Microsoft AMA Troubleshooter script

I recently had an issue with a new linux syslog server that was using Arc and had the AMA service enabled by a data collection rule in Sentinel.

I could see the Sentinel DCR (data collection rule) had been pushed out but the AMA agent wasn’t forwarding logs back up to Sentinel.

I suspected traffic was getting blocked but I wasn’t sure how to validate it.

This script will extract the Sentinel Workspace ID and perform a network connection test that simulates the connection from AMA to the data collection point or ODS(operational data store).

If the script fails, it means you need to talk to your firewall admin to open a connection to *.ods.opinsights.azure.com.

If you’re good at reading curl, you don’t need the script, just curl to
https://<workspaceid&gt;.ods.opinsights.azure.com

The script also checks the the AMA service is running and that you’re not out of disk space – 2 other common issues.

Have fun!

#!/bin/bash

# AMA Agent Validation Script
# Checks common issues with Azure Monitor Agent on Linux

set -e

RED='\033[0;31m'
GREEN='\033[0;32m'
YELLOW='\033[1;33m'
BLUE='\033[0;34m'
NC='\033[0m' # No Color

echo -e "${BLUE}=== Azure Monitor Agent Validation Script ===${NC}"
echo "Started at: $(date)"
echo

# Function to check endpoint connectivity
check_endpoint() {
    local url=$1
    local description=$2
    echo -n "Testing $description... "
    
    if curl -s --connect-timeout 10 --max-time 30 "$url" >/dev/null 2>&1; then
        echo -e "${GREEN}OK${NC}"
        return 0
    else
        echo -e "${RED}FAILED${NC}"
        return 1
    fi
}

# Function to check SSL handshake specifically
check_ssl_handshake() {
    local host=$1
    local description=$2
    echo -n "Testing SSL handshake for $description... "
    
    if timeout 10 openssl s_client -connect "$host:443" -servername "$host" </dev/null >/dev/null 2>&1; then
        echo -e "${GREEN}OK${NC}"
        return 0
    else
        echo -e "${RED}FAILED${NC}"
        return 1
    fi
}

# 1. Check AMA service status
echo -e "${BLUE}1. AMA Service Status${NC}"
if systemctl is-active --quiet azuremonitoragent; then
    echo -e "Service status: ${GREEN}RUNNING${NC}"
    echo "Service uptime: $(systemctl show azuremonitoragent --property=ActiveEnterTimestamp --value)"
else
    echo -e "Service status: ${RED}NOT RUNNING${NC}"
    echo "Try: systemctl status azuremonitoragent"
fi
echo

# 2. Check disk space
echo -e "${BLUE}2. Disk Space Check${NC}"
AMA_PATH="/var/opt/microsoft/azuremonitoragent"
if [ -d "$AMA_PATH" ]; then
    DISK_USAGE=$(df -h "$AMA_PATH" | awk 'NR==2 {print $5}' | sed 's/%//')
    if [ "$DISK_USAGE" -gt 90 ]; then
        echo -e "Disk usage: ${RED}${DISK_USAGE}% (CRITICAL)${NC}"
        echo "Free space needed in $(df -h "$AMA_PATH" | awk 'NR==2 {print $1}')"
        du -sh "$AMA_PATH/events"/* 2>/dev/null | sort -hr | head -5
    elif [ "$DISK_USAGE" -gt 80 ]; then
        echo -e "Disk usage: ${YELLOW}${DISK_USAGE}% (WARNING)${NC}"
    else
        echo -e "Disk usage: ${GREEN}${DISK_USAGE}% (OK)${NC}"
    fi
else
    echo -e "${RED}AMA directory not found${NC}"
fi
echo

# 3. Extract endpoints from config
echo -e "${BLUE}3. Extracting Configured Endpoints${NC}"
CONFIG_DIR="/etc/opt/microsoft/azuremonitoragent/config-cache"
WORKSPACE_ID=""
ENDPOINTS=()

if [ -d "$CONFIG_DIR" ]; then
    # Extract workspace ID and endpoints
    WORKSPACE_ID=$(grep -r "ods.opinsights.azure.com" "$CONFIG_DIR" 2>/dev/null | head -1 | grep -o '[a-f0-9-]\{36\}\.ods\.opinsights\.azure\.com' | cut -d'.' -f1 || echo "")
    
    if [ -n "$WORKSPACE_ID" ]; then
        echo "Workspace ID: $WORKSPACE_ID"
        ENDPOINTS+=("https://${WORKSPACE_ID}.ods.opinsights.azure.com")
    fi
    
    # Add standard endpoints
    ENDPOINTS+=(
        "https://global.handler.control.monitor.azure.com"
        "https://centralus.monitoring.azure.com"
        "https://management.azure.com"
        "https://login.microsoftonline.com"
        "https://ods.opinsights.azure.com"
    )
else
    echo -e "${RED}Config directory not found${NC}"
    # Use default endpoints
    ENDPOINTS=(
        "https://global.handler.control.monitor.azure.com"
        "https://centralus.monitoring.azure.com"
        "https://management.azure.com"
        "https://login.microsoftonline.com"
        "https://ods.opinsights.azure.com"
    )
fi
echo

# 4. Test endpoint connectivity
echo -e "${BLUE}4. Network Connectivity Tests${NC}"
failed_endpoints=0

for endpoint in "${ENDPOINTS[@]}"; do
    if ! check_endpoint "$endpoint" "$endpoint"; then
        ((failed_endpoints++))
    fi
done
echo

# 5. Test SSL handshakes for critical endpoints
echo -e "${BLUE}5. SSL Handshake Tests${NC}"
ssl_failed=0

if [ -n "$WORKSPACE_ID" ]; then
    if ! check_ssl_handshake "${WORKSPACE_ID}.ods.opinsights.azure.com" "Workspace ODS"; then
        ((ssl_failed++))
    fi
fi

if ! check_ssl_handshake "global.handler.control.monitor.azure.com" "Control Plane"; then
    ((ssl_failed++))
fi
echo

# 6. Check for recent AMA errors
echo -e "${BLUE}6. Recent AMA Errors (last 1 hour)${NC}"
if command -v journalctl >/dev/null; then
    error_count=$(journalctl -u azuremonitoragent --since "1 hour ago" | grep -i "error\|failed\|ssl handshake" -c || echo "0")
    if [ "$error_count" -gt 0 ]; then
        echo -e "Recent errors: ${RED}$error_count${NC}"
        echo "Recent SSL handshake failures:"
        journalctl -u azuremonitoragent --since "1 hour ago" | grep -i "ssl handshake" | tail -3
        echo "Recent disk space errors:"
        journalctl -u azuremonitoragent --since "1 hour ago" | grep -i "no space left" | tail -3
    else
        echo -e "Recent errors: ${GREEN}0${NC}"
    fi
else
    echo "journalctl not available"
fi
echo

# 7. Check listening ports
echo -e "${BLUE}7. AMA Listening Ports${NC}"
if ss -tlnp | grep -q ":28330"; then
    echo -e "Port 28330 (syslog): ${GREEN}LISTENING${NC}"
else
    echo -e "Port 28330 (syslog): ${RED}NOT LISTENING${NC}"
fi
echo

# 8. System time check (critical for SSL)
echo -e "${BLUE}8. System Time Check${NC}"
current_time=$(date +%s)
ntp_time=$(curl -s "http://worldtimeapi.org/api/timezone/UTC" | grep -o '"unixtime":[0-9]*' | cut -d':' -f2 2>/dev/null || echo "$current_time")
time_diff=$((current_time - ntp_time))
time_diff=${time_diff#-}  # absolute value

if [ "$time_diff" -gt 300 ]; then
    echo -e "Time sync: ${RED}OUT OF SYNC (${time_diff}s difference)${NC}"
    echo "Current: $(date)"
    echo "Consider: ntpdate or chrony sync"
else
    echo -e "Time sync: ${GREEN}OK${NC}"
fi
echo

# Summary
echo -e "${BLUE}=== SUMMARY ===${NC}"
if [ "$failed_endpoints" -eq 0 ] && [ "$ssl_failed" -eq 0 ]; then
    echo -e "Overall status: ${GREEN}HEALTHY${NC}"
    echo "All endpoints accessible and SSL working correctly"
elif [ "$ssl_failed" -gt 0 ]; then
    echo -e "Overall status: ${RED}SSL ISSUES${NC}"
    echo "SSL handshake failures detected - check firewall/proxy settings"
    echo "Contact network team to whitelist Azure Monitor endpoints"
elif [ "$failed_endpoints" -gt 0 ]; then
    echo -e "Overall status: ${YELLOW}CONNECTIVITY ISSUES${NC}"
    echo "Some endpoints unreachable - check network connectivity"
else
    echo -e "Overall status: ${YELLOW}CHECK REQUIRED${NC}"
fi

echo
echo "Log locations:"
echo "  - AMA logs: journalctl -u azuremonitoragent"
echo "  - Config: /etc/opt/microsoft/azuremonitoragent/config-cache/"
echo "  - Events: /var/opt/microsoft/azuremonitoragent/events/"
echo
echo "Common fixes:"
echo "  - Disk space: Clean /var/opt/microsoft/azuremonitoragent/events/"
echo "  - SSL issues: Whitelist *.ods.opinsights.azure.com in firewall"
echo "  - Service: systemctl restart azuremonitoragent"

Getting Started With Defender for IoT/OT

Pressure is increasing on manufacturers to monitor their shop floors in order to avoid major disruptions in supply chains. A recent example of such a risk is CVE-2023-3595. This vulnerability has a CVSS score of 9.8 (i.e., very bad).

It involves the use of CIP (Common Industrial Protocol). As such, you wouldn’t expect there to be your typical IOCs like IP addresses and hashes that you could add to your SIEM to detect this vulnerability. You would need to sniff your factory network, looking for malicious use of the CIP protocol. This is where OT security tools like Defender for OT come in. (Since we’re just talking about OT here I’m going to drop the IoT…)

Here’s a quick walkthrough to getting started with Defender for OT:

Getting Started with Defender for OT

  • Login to the Azure portal and search for Defender for OT and select ‘Set up OT/ICS Security’
  • Download the sensor and install the ISO in a hypervisor like Hyper-V or VMWare. (when setting up your VM, make sure to use at least 2 network interfaces – 1 for management and 1 for sniffing)
  • Connect the ‘sniffing’ network interface from your VM to a SPAN port on your network. If you’re just playing around with the sensor you can just have it sniff your home network or whatever is safe for you to monitor.
  • After the sensor installation you will be provided 3 unique credentials to login to the sensor’s web interface, so don’t lose those credentials.
  • Get a license – there’s a 60 day trial license here in the M365 admin center:
    https://learn.microsoft.com/en-us/azure/defender-for-iot/organizations/getting-started
  • Go back to the Azure portal and register your sensor. Once the sensor is registered it will give you a zip file which is the license key for that sensor.

How to Test Your Sensor:

  • Download some sample pcap files like from here: https://github.com/EmreEkin/ICS-Pcaps
  • Login to your sensor (https://<ip address of sensor>) with the username ‘cyberx’ and the password that was given to you during the sensor installation.
  • Go to System Settings > Play Pcap, and upload one of your sample pcap files.
  • After selecting ‘play all’, your sensor will begin analyzing your pcap traffic.
  • If nothing interesting is seen in the alerts tab you may need to create a custom alert to trigger some alerts. Some experience with network traffic analysis and Wireshark can be very useful.

Next Steps: Connect Defender for OT to Sentinel

  • Back in the Azure portal, go to the Content Hub and install the Defender for OT solution bundle.
  • Now go to Connectors and enable the Defender for IoT connector
  • Finally go to Analytics, search the templates for all of the OT rules and enable whatever you like.
References:
https://learn.microsoft.com/en-us/azure/defender-for-iot/organizations/ot-deploy/install-software-ot-sensor

https://www.netresec.com/?page=PcapFiles

Cheat Sheet for Configuring Carbon Black Cloud (EDR) for Sentinel

(And a pretty good example of configuring ANY Sentinel data connectors that use APIs and Azure Functions.)

There are several ways to get data into Sentinel.

If your log source requires an API pull, it’s very likely that Sentinel will use an Azure Function app to pull the data.

Vendors have many uses for their APIs so you can’t assume that theirs was built just to please your SIEM.

As a result there is often a bit of a learning curve when trying to understand how to get API logs into Sentinel and how Azure functions play a role.

Here are the 3 basic steps for getting your API logs into Sentinel:

  • Spend some time to understand the vendor’s API – List out all of the available API options. For Carbon Black, there are over 15 APIs!!! But you need just 2 of them for Sentinel.
  • Collect the variables needed to configure the Azure Function – for Carbon Black there are about 15 variables!!! (see cheat sheet below). You’ll need the help of your friendly AWS admin as well as your Carbon Black admin.
  • Get familiar with how to troubleshoot a vendor’s API and Azure Functions – If you’re familiar with curl, wget and/or Postman, then you’re on your way, but that subject is out of scope for this article. For Azure Functions it’s mostly about being able to tweak your variables and how to monitor the output logs (see cheat sheet below).

My cheat sheet for Sentinel Carbon Black Cloud (EDR) Connector

Converting this cheat sheet from Excel to fit in this blog is beyond my skills, so I’ve attached a pdf version.

I’m confident that if you can configure Carbon Black Cloud, you’ll probably have no issue with most other Azure Function API connectors for Sentinel.

I doubt any other connectors will have this many variables!

Addendum: Which audit logs should I collect?

When configuring this connector, there are 4 check boxes to choose from. Here ‘s a brief explanation for them:

CB Alerts Only:
If you just need the CB alerts, then just check off ‘Alert – supported with SIEM API credentials’. This is a good starting point since you don’t have to worry about connecting to AWS.

CB Alerts with All Events
If you need all of the events associated with the alerts, then check off these 2:
Event – supported with aws s3 bucket credentials
Alert – supported with aws s3 bucket credentials
And then proceed to set up an s3 bucket along with everything else.

Audit
These are just basic Carbon Black audit logs, no alerts/events here.
And no need for s3 buckets so enable it with no difficulty.

US National Cybersecurity Strategy

Based on the recent publication of the US National Cybersecurity Strategy, here are some practical suggestions for implementing cybersecurity solutions that loosely map to its guidelines:

  1. Defend Critical Infrastructure by:
  • Expanding the use of minimum cybersecurity requirements in critical sectors to ensure national security and public safety and harmonizing regulations to reduce the burden of compliance

Recommendation: Perform a gap analysis on your cybersecurity defenses. Start with a ‘master list of all recommended defenses and compare that to your organization’s tools’ Prioritize the implementation of any required defenses. Consider consolidation of security solutions under a single vendor’s licence agreement to save on costs. Create good architecture diagrams to describe your infrastructure from a cybersecurity perspective.

  • Enabling public-private collaboration at the speed and scale necessary to defend critical infrastructure and essential services

Recommendation: Create an inventory of all critical assets. If you’re a small org then a manual inventory is fine, otherwise consider a mature asset collection tool to help with this (google ‘asset inventory cybersecurity’ and you’ll get plenty of hits). Use your asset inventory to categorize critical assets and use this information in your SIEM to help with better correlations.

  • Defending and modernizing Federal networks and updating Federal incident response policy.

Recommendation: Review/create incident response policies and procedures. Consider creating specific response procedures that map to your SIEM incidents to improve clarity and incident response times.

  1. Disrupt and Dismantle Threat Actors by:
  • Using all instruments of national power, making malicious cyber actors incapable of threatening the national security or public safety of the United States
  • Strategically employing all tools of national power to disrupt adversaries
  • Engaging the private sector in disruption activities through scalable mechanisms
  • Addressing the ransomware threat through a comprehensive Federal approach and in lockstep with international partners.

Recommendation: Have a clear understanding of the ‘kill chains‘ that may affect your organization. Use Mitre ATT&CK  and your favorite security sites to help research threat actor groups. Identify security tools needed to detect/block attackers. Test/validate the effectiveness of those tools using Red/Blue/Purple team events.

  1. Shape Market Forces to Drive Security and Resilience by:
  • Placing responsibility on those within the digital ecosystem that are best positioned to reduce risk and shift the consequences of poor cybersecurity away from the most vulnerable in order to make the digital ecosystem more trustworthy
  • Promoting privacy and the security of personal data

Recommendation: Move data to the cloud and implement a data protection solution that not only tags and categorizes your data but locks out access if it’s stolen.

  • Shifting liability for software products and services to promote secure development practices
  • Ensuring that Federal grant programs promote investments in new infrastructure that are secure and resilient.
  1. Invest in a Resilient Future by: 
  • Reducing systemic technical vulnerabilities in the foundation of the Internet and across the digital ecosystem while making it more resilient against transnational digital repression

Recommendation: Implement a robust vulnerability assessment solution. Note that moving all your assets to the cloud can make this far easier to manage and can greatly benefit the effectiveness of your CSPM and SIEM.

  • Prioritizing cybersecurity R&D for next-generation technologies such as postquantum encryption, digital identity solutions, and clean energy infrastructure and developing a diverse and robust national cyber workforce.
  1. Forge International Partnerships to Pursue Shared Goals by:
  • Leveraging international coalitions and partnerships among like-minded nations to counter threats to the digital ecosystem through joint preparedness, response, and cost imposition
  • Increasing the capacity of partners to defend themselves against cyber threats, both in peacetime and in crisis; and working with allies and partners to make secure, reliable, and trustworthy global supply chains for information and communications technology and operational technology products and services.

Recommendation: Although many are reluctant to go back to the IBM days of putting all your security solutions into a single basket, cloud vendors and MSSPs have made great progress in the past 5+ years to provide a long list of services under one roof. When looking for one security product it’s very important to think broader and understand the interconnected values between all of your other security tools (XDR!). Security decision makers will often find that re-shuffling several of their security solutions makes more sense than just adding them one brick at a time.

SIEM Use Case Guide – Part 3

Real World Examples

In this section let’s take the real world example of Bloodhound and discuss defensive measures for that use case.

Bloodhound

Step 1: Know thy Enemy.

Have a good list of threat intelligence sites (eg Mitre) that you can use to learn about an attack group or a specific exploit. Bloodhound uses ‘ingestors’ like Sharphound to collect information which it then uses to map out an attack path. So when looking for defenses you may need to look at the ingestors, not Bloodhound itself (although Sharphound may run as a sub-command within Bloodhound).

Step 2: Plan your defenses and build a Blue Team toolkit.

There are many ways to detect and block an exploit, depending on the conditions. But don’t take too much time thinking about the best way to do it when there are some easy wins that you can do right away, for example:

  • Ensure an EDR (and AntiMalware) is installed on all endpoints, and run reports to ensure their rules/signatures are all kept updated.
  • If the EDR vendor provides advanced features, make sure they’re enabled for optimal defenses – eg. enable blocking mode, enable advanced configurations such as Microsoft Defender ASR (Attack Surface Reduction)
  • Configuration Policies – Use tools like Microsoft Endpoint Manager (with Intune) to configure policies on your endpoints to provide a base ‘hardening’ for your devices. Ensure logging is enabled on all servers, including advanced logging for Powershell. If you’re using 1 or more cloud platforms you should be managing your infrastructure’s security policies with a CSPM (cloud security posture management) like Microsoft Defender for Cloud – this can also add additional defenses like FIM – File Integrity Management.

Step 3: Build Process For Faster Response

Once you have a list of tools/methods for building defenses, create a checklist and start filling it out. You’ll find that after adding a few rows a common pattern will arise for similar exploits, so your ‘Defender’ job should get a bit easier over time.

Example Defender Framework/Checklist

See also:

Making Security Fun with Microsoft Cloud Games

This is a really fun way to learns some practical skills with Microsoft Cloud security tools.

I would recommend this for anyone who has a Microsoft E5 license or anyone using Microsoft cloud based products who is ready to get serious about securing their cloud and on-prem environment with Microsoft security tools.

This is not for beginners.

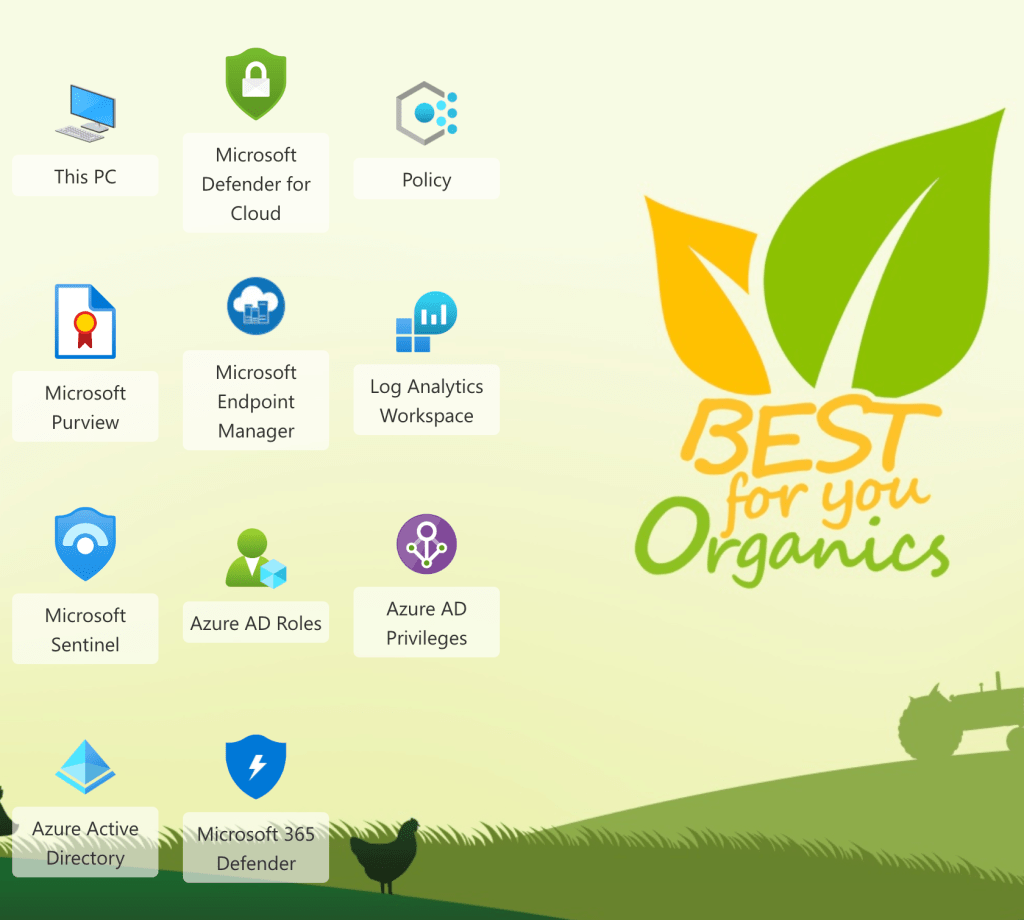
It’s expected you have at least a basic understanding of what these security tools are shown in this screenshot from the game:

Expect to spend at least a couple of hours playing the game.

Have fun!

Mapping Cyber Defense Use Cases to Mitre ATT&CK Data Sources

Mitre ATT&CK provides so many ways to quantitatively think about approaches for defending against attackers.

However it can be challenging to map the ATT&CK matrix to to real-world defense methods.

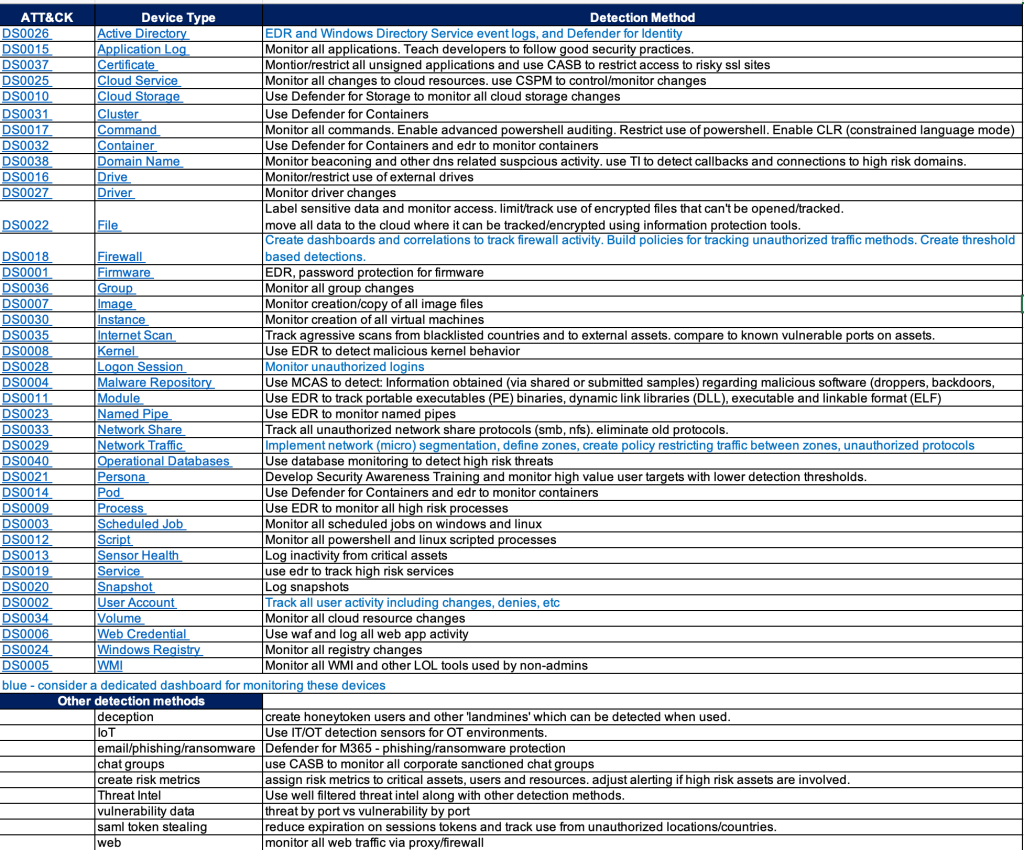
One approach is to look at the ATT&CK data sources and research detections that would map to those data sources.

This still requires some experience and a bit of guessing since there doesn’t appear to be an easy button way to map data sources to detection tools.

Endpoint Detection vendors have done a pretty good job mapping detections to ATT&CK techniques but few of them share their mappings in a simple spreadsheet – that would greatly help validate your detection gaps.

SIEM products like Microsoft Sentinel have done a good job mapping detection rules AND log sources to ATT&CK.

The chart below is an example of an easy way to provide a path forward on where to focus efforts for detections. It also provides a gap analysis for any obvious security tools that may be missing in your environment.

And hopefully my short detection method recommendations will give you some ideas or at least stir conversation.

Blue Teaming – My Top 10 Solutions for a Successful SOC Defense Strategy

(in no particular order – includes both on-prem and cloud)

SIEM Attack Simulations and tuning
Configure test lab and simulate attacks to verify triggering of alerts

Active Defenses/Deception Techniques
Plan/Deploy/Test deception techniques

Use Case Catalog
Documented methodology for providing clear/concise implementation of SIEM use cases based on existing log sources and a focus on threat and compliance related detections.

SDLF – Security Data Logging Framework
Documented methodology for providing clear/concise implementation of log sources into SIEM for assured value. (perhaps I need to blog about this)

Cloud Diagnostic Checklist
Checklist of O365 and Azure security features to improve awareness of security features available with an E5 license.

Purple Teaming
Red/Blue teaming activity with a focus on improving awareness of SOC security best practices.

Attack Surface Mapping
Network and asset discovery discussions with a focus on attack surface mapping

EDR attack simulations
Setting up attack simulations for your EDR

SOAR Development
Creation of automated actions to both enhance SIEM alert details and provide automated actions as a result of a given incident.

Cloud Security Posture Planning and development
Planning and deployment of CSPM/CWPP

Validating your SIEM Rules

Here are some thoughts on SIEM ‘Use Case Validation Testing’.

Most of the time I work with SIEMs that have decent out of the box rules/correlations, so you can match the available log sources to the available correlations and you’re basically done.

Occasionally I’ll be asked to validate the correlations through some sort of testing process.

This works fine for old-school detections and basic compliance rules, where it’s easy to have the customer perform some action like 3 login denies to trigger a matching correlation.

However it’s not so easy to say “perform a Teardrop and a Hafnium attack”, so specific threat based attack simulations are not practical.

So here’s an outline for how to approach SIEM rule validation:

  • List out the high level ‘tactics’, using MITRE or just a simpler list to get things started. Remember these tests must be associated with your available log sources eg:
    • Authorizations – password spray against a domain controller – using Active Directory or Azure AAD logs.
    • Threat – triggering a virus detection – using Microsoft Defender for endpoint
    • Keep adding to this list based on: <tactic> <available log source>
    • Try to provide at least one test for each available log source and grow from there.
    • Note that some log sources may not be use for correlations, but as investigative evidence for post-detection analysis.

Now that you have a list of detections, you need a ‘toolkit’ of methods for performing your attack simulations. Consider these:

  • Create a lab space
    • Many of these attack simulations should not be performed on production systems! A lab space provided the freedom to experiment more freely without the risk of doing harm.
  • Purple Teaming
    • Hire a pro and do end to end validations.
    • This approach helps educate your entire SOC/blue team on how the correlations work and how to tune them for appropriate detections.
    • It may also include a Compliance and/or MITRE APT planning session to map your correlations to appropriate controls.
  • Attack Simulations
  • Active Defenses
    • Configuring ‘cyber deception‘ within your network is a good way to make your red teamers cry. Simply having some user accounts enabled (with no login privileges) is enough to trigger an alarm in your SIEM when someone tries to login with it.
    • Simply create some user accounts, spread around some files and start playing minesweeper with your red team (DJ I can’t get minesweeper out of my articles after you mentioned it).

So SIEM use case validation testing is an excellent task for all cybersecurity teams, but it does require some effort and coordination between all of your security teams – often more than the initial SIEM setup itself.

SIEM Use Case Guide – Part 2

And I’m talking real smoking guns, not crappy anomaly alerts.

From my experience, the most effective use cases for threat detection are those which simply:

  • Provide a list of detections which have a high confidence of threat
  • Look for validations which follow the detection.

So:

Here’s an example for logic that would provide good use cases involving malicious intent:

  • First create a list of detections that provide very high confidence of a threat.
    • This is easier than you think if you’ve been using a SIEM for some time.
    • Just look back at both rules that have fired and those which have not.
      • The ‘have not fired’ rules like ‘Hafnium detected’ are likely very fined rules so when they do alert it’s likely for good reason.
      • The rules that have fired, are consistently a true positive, and identify as a threat, is likely a very short list.
  • Follow that with evidence from 1 or more additional alerts to ‘validate’ the first alert.

The ‘direction’ of the action might also be important, eg:
Inbound > outbound detection with validation of sustained activity.

Here’s a couple of specific examples:

  1. Detection: EDR callback
    1. Relevant entities: src_ip and dest_ip
    2. Validation1: EDR detection fires a 2nd distinct threat alert at src_ip
    3. Validation2:Firewall traffic continues for 15 min to dest_ip
  2. Email Malware ‘onclick=true’ (user clicked on a malicious link)
    1. Then followed by logic from rule #1 above.

Additional thoughts:

Validations do not have to be part of the SIEM threat detection. They can be added from SOAR playbook(s) and apply ‘tags’ to the alert, which can in turn be used by other correlations or SOAR playbooks. Eg. tag: EDR_distinct_threats=2, callback_distinct_count=2

This means the correlations become VERY simple and the validation or ‘recorrelations’ steps are done by the SOAR action.

By using SOAR you can provide full automation of an action by isolating a machine, disabling a user etc.

There should be pressure put on vendors to provide a ‘metric of confidence’ on specific detections. i.e. does ‘High’ really mean High? This makes it easier to create use cases with clear malicious intent since you wouldn’t have to manually compile a list of high confidence detections.

Some thoughts on high confidence alerts:

  • Most Sentinel analytic rules with a value of High are high confidence.
  • Deception related alerts – this is a new term for many, but it’s catching on.
  • Callbacks – Fireeye first made these famous and they’re still a good example of a reliable alert.

Part 1 – Super Simple SIEM Use Case Guide

Part 3 – Real World Use Cases