Why your SIEM engineer might be your next AI hyperscale engineer

Normalization is what lets 1,000 correlation rules read every source through one schema, and it is what lets any number of agents use the same data. SIEM skills mapped to multi-agent systems, with security and healthcare examples, a practical Microsoft architecture and an interactive visual.

Why your SIEM engineer might be your next AI hyperscale engineer

A multi-agent system that processes security events has the same outer shape as a SIEM pipeline. Events are collected, queued, normalized, evaluated and acted on. What changes is the processing node: a deterministic rule is replaced, or supplemented, by a model call that returns structured output and can call tools. The part of SIEM work that matters most at agent scale is normalization. A normalized schema is what lets a thousand correlation rules read hundreds of sources, and it is what lets any number of agents use the same data without each agent handling each source format. As a bonus, I’ve added an interactive visual that shows 1,000 rules and 1,000 agents on the same normalized layer, with and without it.

DAVID BROGGY · 2026-11-05
01
01 /

Data normalization is key to hyperscaling agents

A SIEM with 140 sources and 1,000 analytic rules does not have 20,000 integrations, which is what it would take for each rule to read the 20 or so raw sources in its schema directly. Each source has one parser into a common schema such as ASIM or the Splunk CIM, and each rule is written once against the schema. In Microsoft Sentinel a rule that queries _Im_Authentication covers Entra ID, Okta, AWS CloudTrail and every other authentication source with a parser, including sources added after the rule was written. The integration count is one parser per source, and the rules add none. (A standard Sentinel workspace allows 512 enabled scheduled rules; 1,000 needs a dedicated cluster, which allows 1,024, or a second workspace.)

What works: SIEM correlation rules and agents both reading normalized data
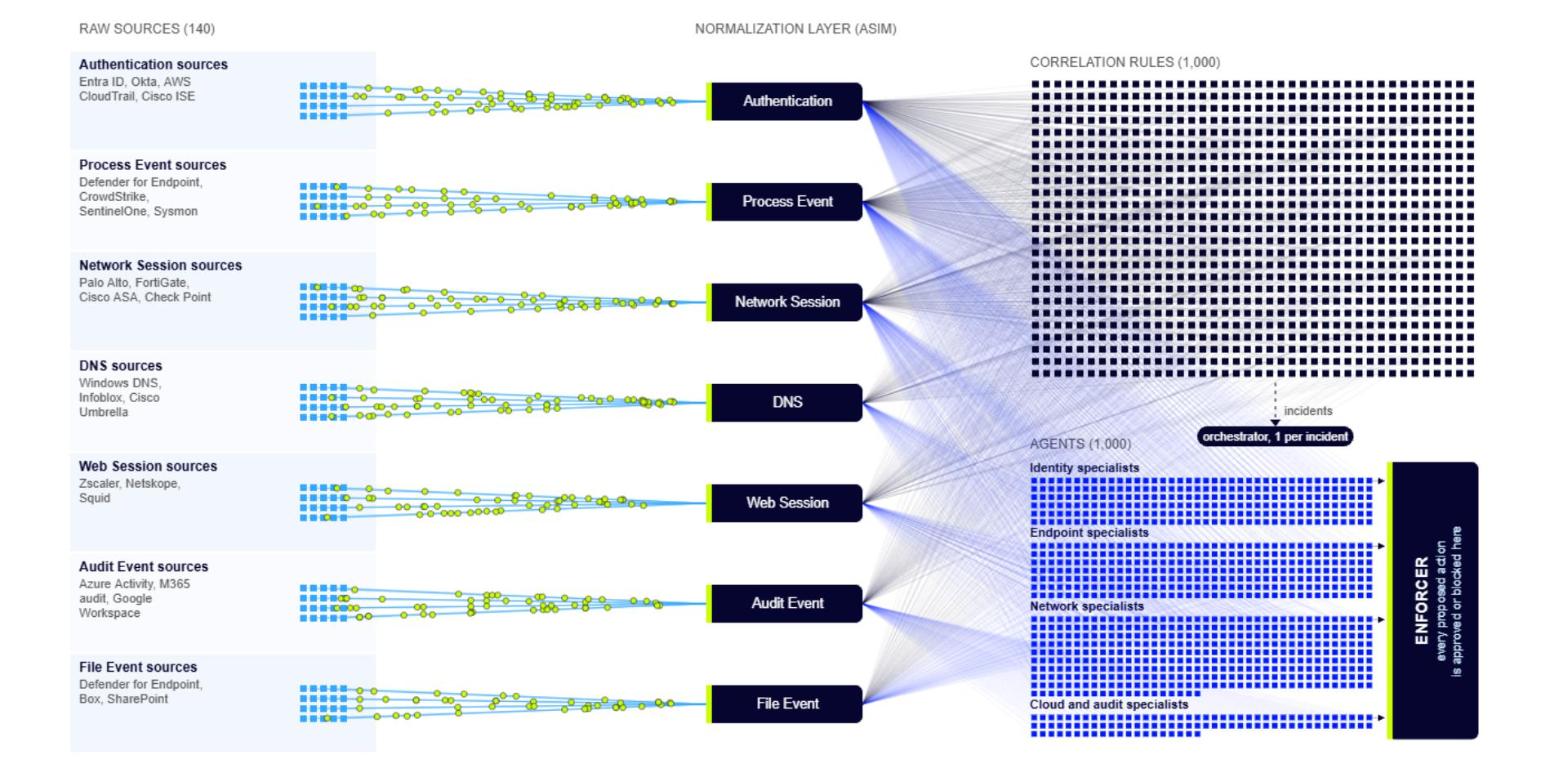
140 sources feed seven ASIM schemas, which 1,000 rules and 1,000 agents read

Figure 1. With normalization: 140 sources, 7 schemas, 1,000 rules and 1,000 agents

Left to right: 140 raw sources grouped by the ASIM schema they map to, the seven schemas in the middle, then the two consumer fleets, 1,000 analytic rules (navy) and 1,000 agents (blue). Each source has one line into its schema, and every rule and agent reads only the schemas. The agents are grouped into four specialist types, one per schema family. Incidents from the rules start an orchestrator (one per incident), which hands work to the specialists, and everything they propose goes through the enforcer bar on the far right before it can change a system. That is the SOAR playbook split in three. Moving dots are events. Adding agents adds dots on the right and no lines on the left.

Agents are consumers of the same data, and the same arithmetic applies. Without a normalized layer, every agent that investigates sign-ins has to read every raw authentication format, either through source-specific tools or by working out each format from the raw record on every call. With 140 sources spread across seven schemas, that is about 20 source-specific integrations per agent, and about 40,000 across 1,000 rules and 1,000 agents. Each new agent adds 20 more. Each field rename at a source breaks every rule and agent that reads that source directly, and agents that interpret raw formats themselves spend tokens doing it and can reach different conclusions from the same record.

What doesn't work: SIEM rules and agents reading every source without normalization
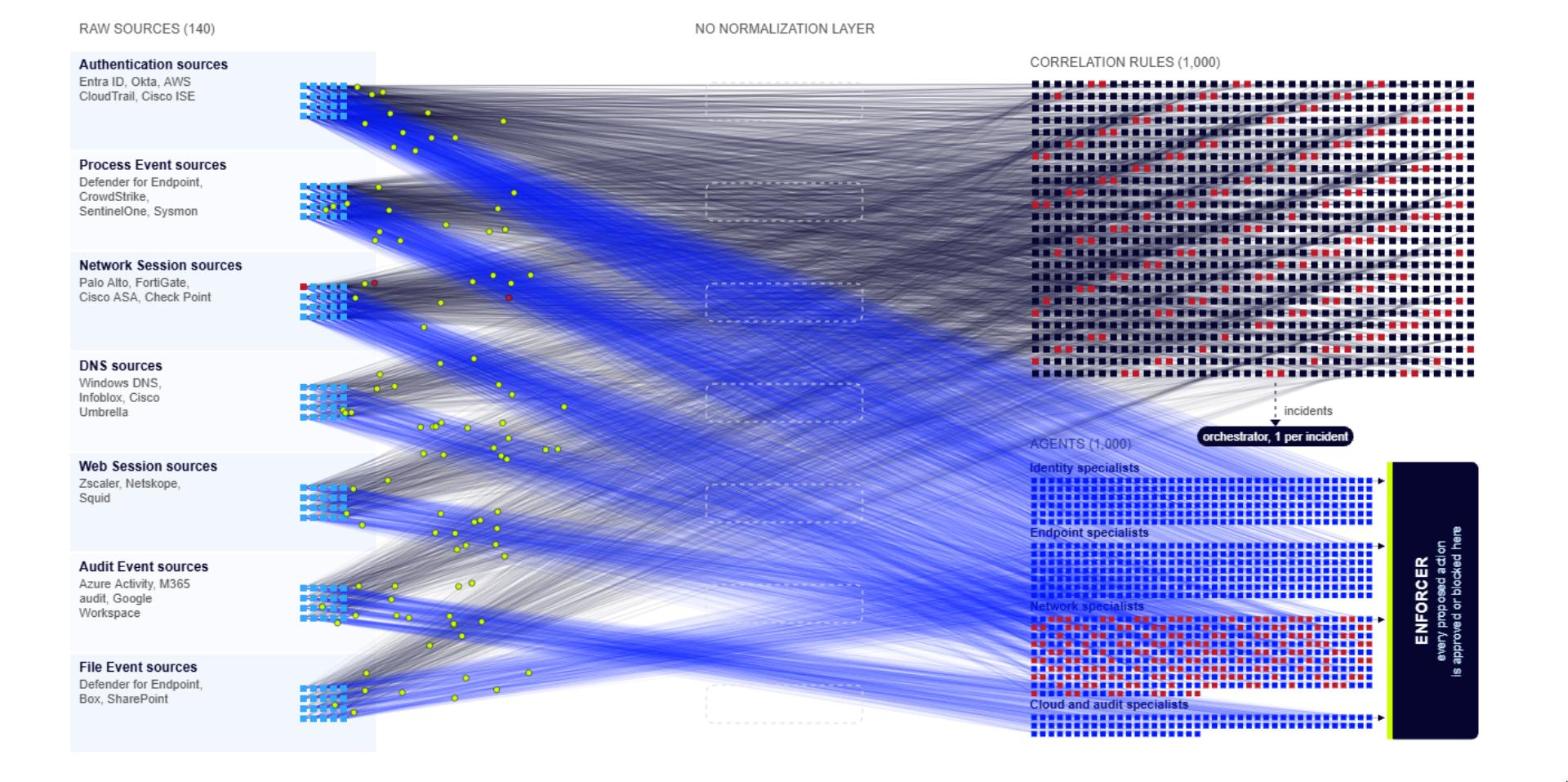
Without the schema layer every consumer connects to every source in its schema

Figure 2. Without normalization: every rule and agent wired to every source

The same 140 sources and 2,000 consumers with the schema layer removed. Every consumer now needs a line to each source in its schema; the drawing shows a sample of the 40,000. Red dots are the rules and agents that read a FortiGate field directly; the field was just renamed, so they are now broken.

With the normalized layer, the ASIM parsers are KQL functions, so the function an analytic rule calls is the same function an agent’s query tool calls. Adding the 1,001st agent requires no new parser and no new integration. Adding a source requires one parser, and every existing rule and agent covers it. A field rename at a source is fixed once, in its parser. The number of agents is then limited by model capacity and query limits, not by integration work. The Log Analytics query API, for example, runs 5 concurrent queries per identity and queues up to 200 before returning HTTP 429, so query load is planned across agent identities the way rule load is planned across workspaces.

A common objection is that MCP already handles this. MCP standardizes how an agent finds and calls a tool: the transport, the tool description, and a JSON schema for each tool’s inputs and, optionally, its outputs. Each server author chooses that schema. The protocol has no shared model for a sign-in, a firewall session or a lab result, so an MCP tool that queries a raw table returns that table’s field names, and thirty authentication sources behind thirty MCP tools are still thirty formats. In the architecture later in this post, MCP is the tool layer that carries the data to agents; ASIM or FHIR defines its shape.

The work that makes this possible is existing SIEM work: onboarding sources, writing and testing parsers, maintaining schema coverage, and monitoring connector health. That work does not change when the consumers are agents. It becomes the precondition for running them at scale.

02
02 /

Component mapping

Each part of a SIEM pipeline has a counterpart in a multi-agent pipeline. The table lists them side by side.

DimensionSIEM pipelineMulti-agent pipeline
RuntimeCollection and indexing tier (Splunk, Elastic, Microsoft Sentinel, with Cribl or Vector in front)Agent runtime (for example Microsoft Foundry Agent Service or Amazon Bedrock AgentCore), which schedules model calls and tool calls
Unit of workA log event: a structured or semi-structured record of a state changeA message on an agent’s input queue: an event, a tool result or a request, with a schema
NormalizationParsers and data models (ASIM, Splunk CIM, grok patterns)The same parsers and schemas, exposed to agents as query tools, plus a schema contract (a Pydantic model or JSON Schema) on each agent’s inputs and outputs
DetectionAnalytic rule or saved search: a fixed conditionSpecialist agent: a system prompt, a scoped set of tools and a typed verdict
TransportKafka, Event Hubs, a forwarder queue, partitioned by keyPer-investigation input queues, processed in order for each investigation and in parallel across them
ResponseSOAR playbook or Logic App with a fixed branch treeTool calls proposed by agents and approved or rejected by an enforcer
TestingDetection-as-code with sample logs and expected matchesEvaluation sets: replayed incidents with expected verdicts and expected actions
Cost controlIngestion tiers, data lake versus analytics tier, retentionToken budgets, model tiering, and suspending agents while they wait on tools

The normalization, transport, ordering and cost rows are where SIEM experience transfers almost directly. The detection and response rows are where the work changes.

03
03 /

Agent data stream schema example

A SIEM rule depends on field names. If a custom application changes user_id to uid, the parser still runs, the user field comes back empty, and the analytic rule stops matching. Nothing errors. The detection goes quiet and the gap is found later in a coverage review, or after an incident.

In an agent pipeline the same boundary is handled with a schema contract. Every event that enters the pipeline is validated against a typed model, and every verdict an agent returns is validated against another. A Python sketch:

from typing import Literal
from pydantic import BaseModel, Field

class SignInEvent(BaseModel):
    user_principal_name: str
    ip_address: str
    result_code: int
    app_display_name: str | None = None

class TriageVerdict(BaseModel):
    verdict: Literal["benign", "suspicious", "malicious"]
    confidence: float = Field(ge=0, le=1)
    evidence: list[str]
    proposed_actions: list[str]

When an event fails validation, the pipeline has a choice a SIEM parser does not have. A mapping step can pass the raw record and the contract to a model and ask which source field corresponds to user_principal_name. The model’s answer is a proposal, not a fix. It is validated against the contract, written to a log, and used to open a ticket to correct the parser. The model does not remove the need for normalization. It gives the pipeline a fallback path when a source drifts, and it makes the drift visible instead of silent.

The skills that apply here are the ones SIEM engineers already use: knowing the target schema (ASIM or CIM), writing field-level data quality checks, and testing parsers against real samples before a source goes live.

04
04 /

Correlation rules in SIEM are similar to agent logic

An analytic rule is cheap, fast and deterministic. It runs in milliseconds, costs nothing per evaluation beyond the query, and gives the same answer every time. A model call takes seconds, costs tokens and can return different answers for the same input. Replacing every rule with an agent would raise cost and lower predictability for detections that already work.

A practical design keeps the analytic rules. Rules filter and score the high-volume stream. Agents take over at three points the rules handle poorly:

  • Triage of incidents the rules have already raised, where an analyst would normally pull context from several tables before deciding.
  • Free-text input, such as a phishing report written by a user, that no field-based rule can parse.
  • Sources that fail normalization, where the mapping step described above applies.

Each specialist has one job, its own system prompt, and only the tools that job needs. An identity specialist can query SigninLogs and AuditLogs. An endpoint specialist can query DeviceProcessEvents. An email specialist can query EmailEvents and UrlClickEvents. The scoping is the same least-privilege work done today for a Logic App’s managed identity or a Splunk service account.

05
05 /

SOAR playbooks vs agentic orchestrator, specialists, and enforcer

A SOAR playbook encodes every branch in advance. The agent version splits that work across three roles:

  • The orchestrator reads the incident, decides which specialists are needed, and starts them. It does not take actions itself.
  • The specialists investigate in parallel and each return a typed verdict with evidence and proposed actions.
  • The enforcer checks every proposed action before anything runs.

The enforcer should be code, not a model. It applies fixed rules: an allowlist of permitted actions per incident type, a list of protected accounts (break-glass accounts, the Entra Connect sync account, executives under a separate process), a blast-radius limit such as no more than five accounts disabled per incident, and a human approval requirement for destructive actions such as soft-deleting mail or isolating a server. These are the approval gates and change-control rules that already sit inside mature SOAR playbooks, moved out of each playbook into one place that every agent passes through.

The enforcer matters more in security than in most agent deployments because log content is attacker-controlled. A user agent string, an email body, a file name or a command line can contain text written to instruct a model. A specialist that reads a phishing email is reading the attacker’s words. Treat every field that came from a log as untrusted input, keep it out of system prompts, and rely on the enforcer, not the specialist’s judgment, to stop an action the attacker’s text talked the model into proposing.

Each agent should also have its own identity, for example a Microsoft Entra Agent ID, so that its queries and actions appear in sign-in and audit logs under a name that can be monitored, scoped by Conditional Access, and disabled. The agent pipeline becomes a log source for the SIEM it supports.

06
06 /

Testing and operating the pipeline

Detection-as-code practice carries over with one change. A rule test checks that a sample log produces a match. An agent test checks that a replayed incident produces the expected verdict and the expected proposed actions, within a confidence range, across repeated runs, because the output is not deterministic. Build the evaluation set from closed incidents with known outcomes, and rerun it whenever a prompt, a model version or a tool changes.

Operational metrics also carry over. Ingestion volume per day becomes tokens per incident. Rule latency becomes time to verdict. False positive rate stays as it is. Add two that SIEM pipelines do not need: the rate at which the enforcer rejects proposed actions, and the rate at which schema validation fails on agent output. A rising rejection rate means a prompt or a model change has made a specialist less reliable, and it should be visible on a dashboard before it causes a missed action or a wrong one.

07
07 /

Skills that transfer and skills to add

Skills that transfer with little change:

  • Normalization to a common schema and data quality checks at ingestion.
  • Queue design, partitioning and ordering.
  • Enrichment as an asynchronous lookup.
  • Least-privilege service identities for automation.
  • Approval gates and change control in response automation.
  • Detection testing against known samples.
  • Cost management by tier and volume.

Skills to add:

  • Writing system prompts as specifications, with the output schema defined first.
  • Building and maintaining evaluation sets.
  • Choosing models by task, with smaller models for mapping and classification and larger ones for investigation.
  • Defending against prompt injection from log content.
  • Designing an enforcer as code, separate from the agents it controls.
08
08 /

A use case: Hyperscale agentic use for healthcare

Hospital networks have the same structure. Patient data arrives from EHR registration, lab systems sending HL7 v2 results, admit, discharge and transfer feeds, pharmacy and e-prescribing systems, radiology and pathology, and claims. HL7 FHIR plays the role ASIM plays in Sentinel: each system is mapped once into FHIR resources such as Patient, Observation, Encounter, MedicationRequest, Condition, Procedure and DiagnosticReport, with standard codes (LOINC, RxNorm, ICD-10). FHIR R4 is the version required for patient access APIs in certified US EHR technology under the ONC Cures Act Final Rule.

The consumers are clinical decision support rules, such as sepsis screening or drug-interaction checks, and agents for prior authorization, care-gap outreach and coding review. The arithmetic is the same as for detections. With FHIR in place, a new agent calls the FHIR API and needs no interface work for any of the source systems. Without it, each agent decodes each feed itself. A source change shows the cost: if a lab system starts sending glucose in mmol/L instead of mg/dL, the FHIR mapping is corrected once, while every rule and agent reading the raw value directly sees results about 18 times too low. In security that is a missed detection; in healthcare it is a patient safety issue.

09
09 /

Practical architecture

In Microsoft terms the design has five layers, and the order matters. Sources are onboarded and normalized first; the rule fleet reads the normalized store directly; agents reach it only through a tool layer; an agent runtime hosts the agent types and their concurrent runs; and an enforcer stands between proposed actions and anything that changes a system. Identity and observability apply to every layer.

  • Normalized data: Microsoft Sentinel’s analytics tier and data lake with ASIM parsers. This is where the 1,000 rules run.
  • Tool layer: the Sentinel MCP server, with custom tools built from saved KQL queries that call the ASIM functions. Agents call tools and never read raw tables.
  • Agent runtime: Microsoft Foundry Agent Service for the fleet, which Microsoft documents as having no limit on the number of agents in a project, with rate limits applied at the model deployment. Security Copilot hosts a few agent types embedded in Defender and Entra and is billed in Security Compute Units.
  • Actions and oversight: Logic Apps playbooks with approval steps, a protected-account watchlist and blast-radius limits, then Defender and Entra response actions.
  • Identity and observability: an Entra Agent ID per agent group, OpenTelemetry traces to Application Insights, and agent activity written back to Sentinel as a log source.
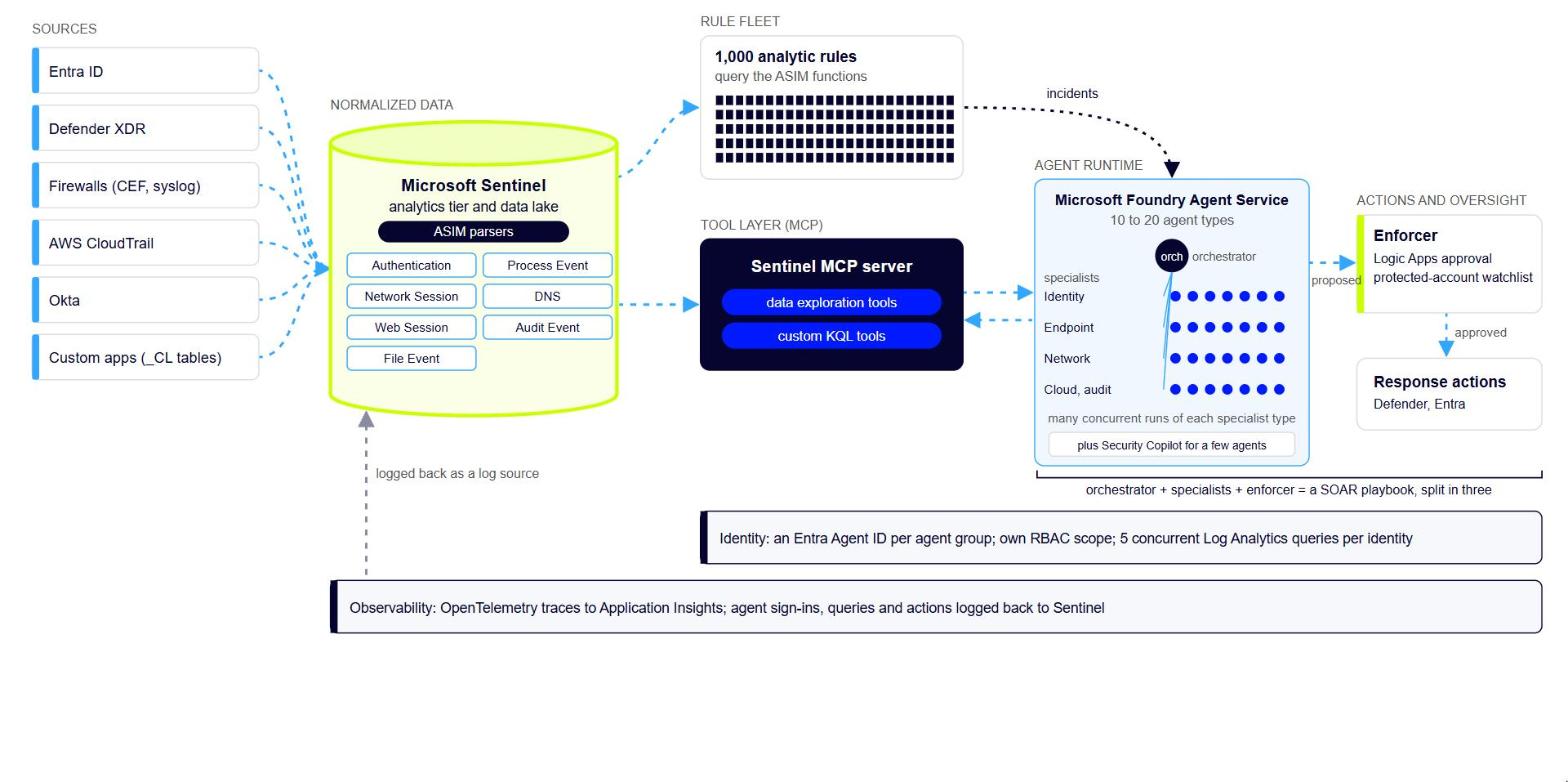
Security architecture: sources, Sentinel with ASIM, Sentinel MCP server, Foundry agents, enforcer

Figure 3. Security architecture on Microsoft: Sentinel, ASIM, MCP, Foundry

Left to right. Six source types feed the normalized store (the lime cylinder: Sentinel analytics tier and data lake with the seven ASIM schemas). The rule fleet reads it directly, and the dashed navy line shows incidents from rules starting agent work. Agents reach the data only through the Sentinel MCP server in the middle. Inside the agent runtime, an orchestrator routes each incident to specialist groups (identity, endpoint, network, cloud and audit), each running many concurrent copies. Proposed actions pass through the enforcer before response actions run; the bracket under the runtime marks orchestrator, specialists and enforcer as the three parts a SOAR playbook used to hold. The two bands at the bottom apply to every layer; the grey dashed line is agent activity logged back to Sentinel.

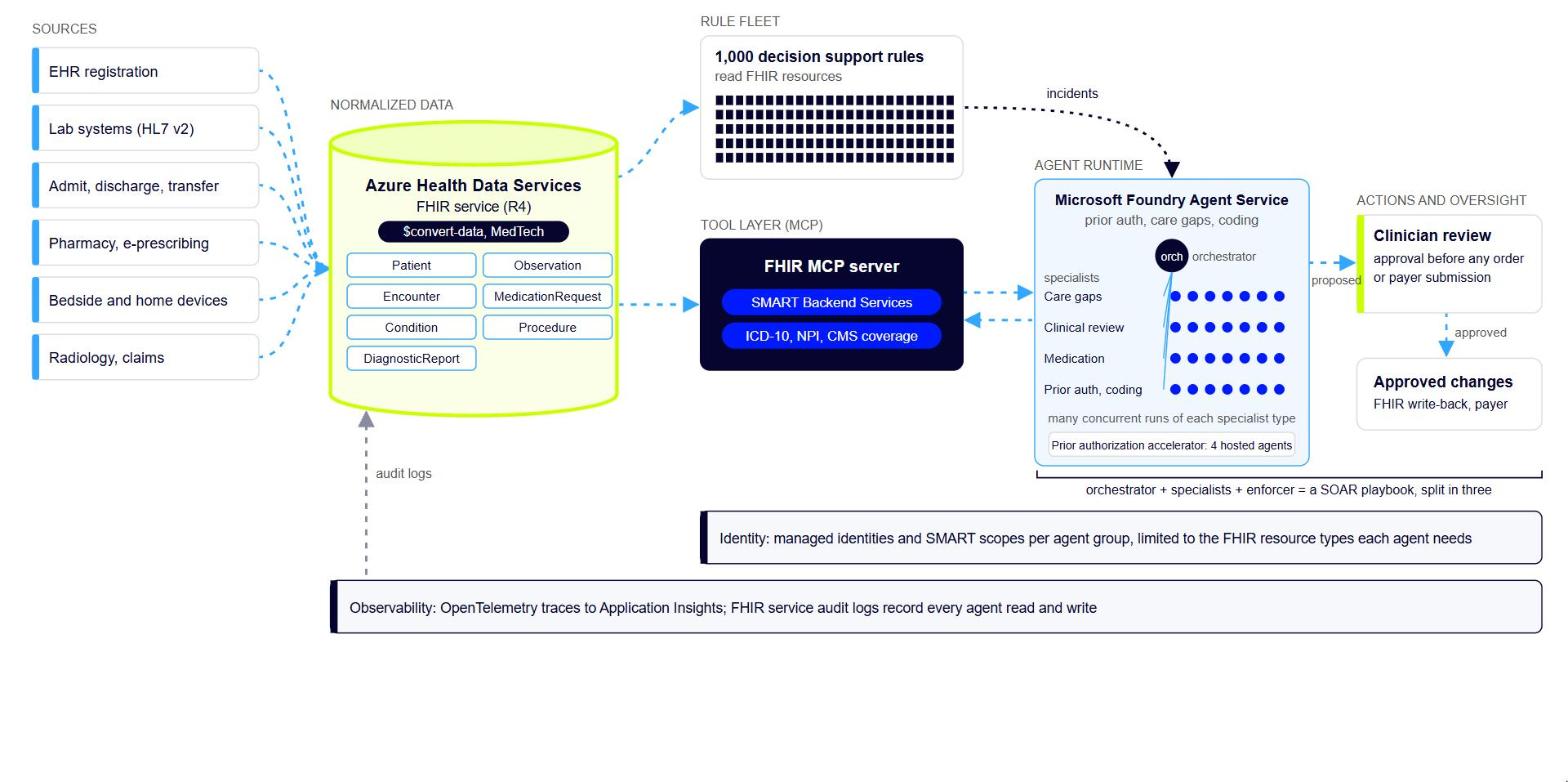
The healthcare version uses the same layers. The Azure Health Data Services FHIR service is the normalized store, with $convert-data turning HL7 v2 and C-CDA into FHIR resources and the MedTech service mapping device data to Observation. A FHIR MCP server using SMART Backend Services authentication is the tool layer, alongside reference servers for ICD-10 codes, the NPI Registry and CMS coverage policies. Foundry hosts the agents; Microsoft publishes a prior authorization multi-agent accelerator with four hosted agents as a Foundry template. A clinician approves any order, payer submission or record write-back.
Healthcare architecture: clinical systems, FHIR service, FHIR MCP server, Foundry agents, clinician review

Figure 4. Healthcare architecture on Microsoft: FHIR service, MCP, Foundry

Same layout as the security diagram. Clinical systems on the left feed the FHIR service, which holds seven FHIR resource types. Decision support rules read FHIR directly; agents reach it through the FHIR MCP server. The orchestrator routes work to care-gap, clinical review, medication, and prior auth and coding specialists. Proposed actions stop at clinician review, which plays the enforcer role, and approved changes are written back through the FHIR API. FHIR service audit logs record every agent read and write.

10
10 /

The visual and the source

The accompanying page draws 140 raw sources grouped by ASIM schema, the seven schemas in the middle, and two consumer fleets on the right: 1,000 correlation rules and 1,000 agents. With normalization selected, each source has one line to its schema and every consumer reads only the schema. With normalization removed, every consumer needs a line to every source in its schema, and the drawing becomes a dense mesh. Sliders change the number of sources and agents, and a counts table gives both designs side by side: integrations to maintain, work to add one agent, work to add one source, and consumers broken when a FortiGate source renames a field. Adding 1,000 agents to the normalized design adds no integrations; adding them without normalization adds about 20,000. A second button switches the same diagram to the healthcare example, with FHIR resources as the middle layer and decision support rules and clinical agents as the consumers. An Architecture view draws each example as Microsoft services: Sentinel with ASIM, the Sentinel MCP server and Foundry Agent Service for security; the Azure Health Data Services FHIR service, a FHIR MCP server and Foundry Agent Service for healthcare.

The visual is at https://broglock.github.io/siem-to-agent-normalization/ and the source, including this post, is at https://github.com/broglock/siem-to-agent-normalization.

11
11 /

Security agent use cases by data schema

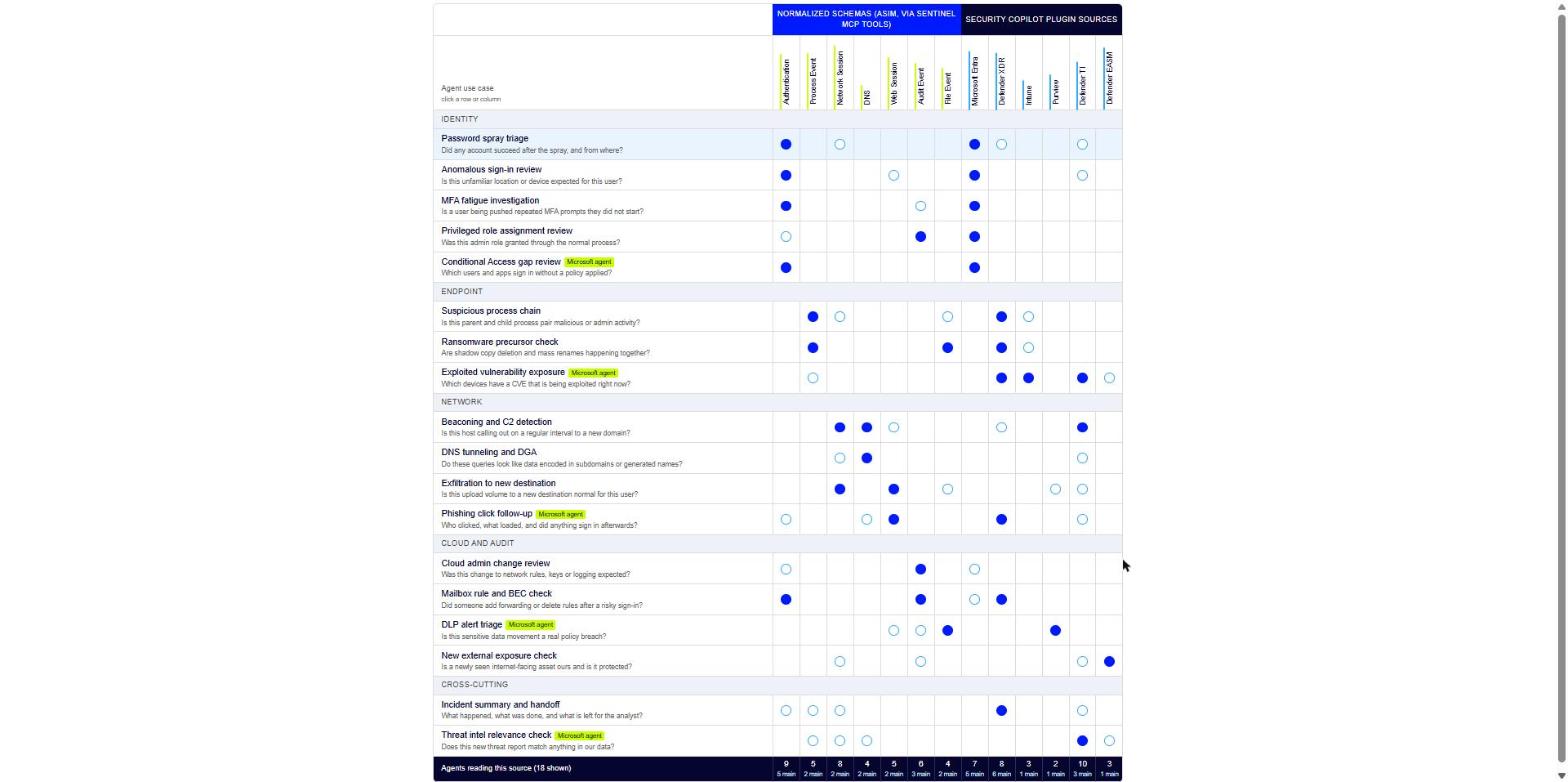
A second page maps 18 security agent use cases to the data each one reads. The columns are the seven normalized schemas from the visual (Authentication, Process Event, Network Session, DNS, Web Session, Audit Event and File Event), which agents reach through custom Sentinel MCP tools, and six Security Copilot plugin sources: Microsoft Entra, Defender XDR, Intune, Purview, Defender Threat Intelligence and Defender External Attack Surface Management. A solid dot marks the main source for a use case and a ring marks a context source. The bottom row counts the agents that read each source.
Matrix of 18 security agent use cases against seven normalized schemas and six Security Copilot plugin sources

Figure 5. Security agent use cases mapped to normalized schemas and Security Copilot plugins

Rows are agent use cases grouped by specialist family: identity, endpoint, network, cloud and audit, and cross-cutting. The blue columns are the seven normalized schemas, reached through custom Sentinel MCP tools; the navy columns are Security Copilot plugin sources. A solid dot is the main source for that agent and a ring is a context source. A lime tag marks a use case Microsoft already ships as a Security Copilot agent.

Five of the use cases overlap agents Microsoft already ships in Security Copilot: Conditional Access Optimization, Vulnerability Remediation, Phishing Triage, Purview DLP alert triage and Threat Intelligence Briefing. Building your own version is still useful when it needs to read non-Microsoft sources through the normalized schemas. Selecting a row on the page shows its trigger rule, the tools it needs and the actions it proposes. The matrix is at https://broglock.github.io/siem-to-agent-normalization/use-case-matrix.html.

12 /

References

FIELD NOTES · SIMPLE-SECURITY.CA

Hunting across hundreds of log sources in the Sentinel data lake

Normalizing hundreds of third-party log sources once, into a hunt index in the Microsoft Sentinel data lake: four mapping methods, scheduled KQL jobs and notebooks, cost at 1 TB a day, and limits.

Hunting across hundreds of log sources in the Sentinel data lake

Microsoft Sentinel data lake makes it affordable to keep hundreds of third-party log sources for a year or more. Hunting across them is harder. Each source names the same things differently: an IP address is SourceIP in one table, src in another, and buried inside free text in a third.

ASIM (the Advanced Security Information Model) is Microsoft’s answer to this in the analytics tier. It does not carry over to the lake as it is, for three reasons:

  • ASIM parsers are stored KQL functions, and lake KQL does not run stored functions.
  • Each parser is written for one product’s table and message format. A source without a parser gets no normalization.
  • Parsers run at query time. Over a year of lake data, that cost is paid on every hunt.

This matters more now that hunts start from an AI agent. The Sentinel data lake MCP server lets an agent write and run KQL against the lake. An agent asked “where has this IP shown up?” needs one field name to search, not three hundred.

DAVID BROGGY · 2026-10-26 · DEPLOYED IN A TEST TENANT
01
01 /

Normalize once, into an index

My approach is to do the normalization work once, ahead of time, and store the result in the lake. Scheduled lake jobs read every source table and write two tables:

  • HuntEntity holds one row per entity, per hour, per source and role (an IP, a user, a host, a URL, a hash), with its type, its role (source, destination, actor, target, device), a lowercase join value, a count, first and last seen times, and a few sample record keys. Rolling up by the hour keeps the table small enough to search a full year cheaply.
  • HuntEvent holds sign-ins, network sessions and other events with ASIM field names such as SrcIpAddr, TargetUsername and EventResult, for sources mapped well enough to trust. It is rolled up by the hour too: repeated events with the same user, addresses, result and action become one row with a count.

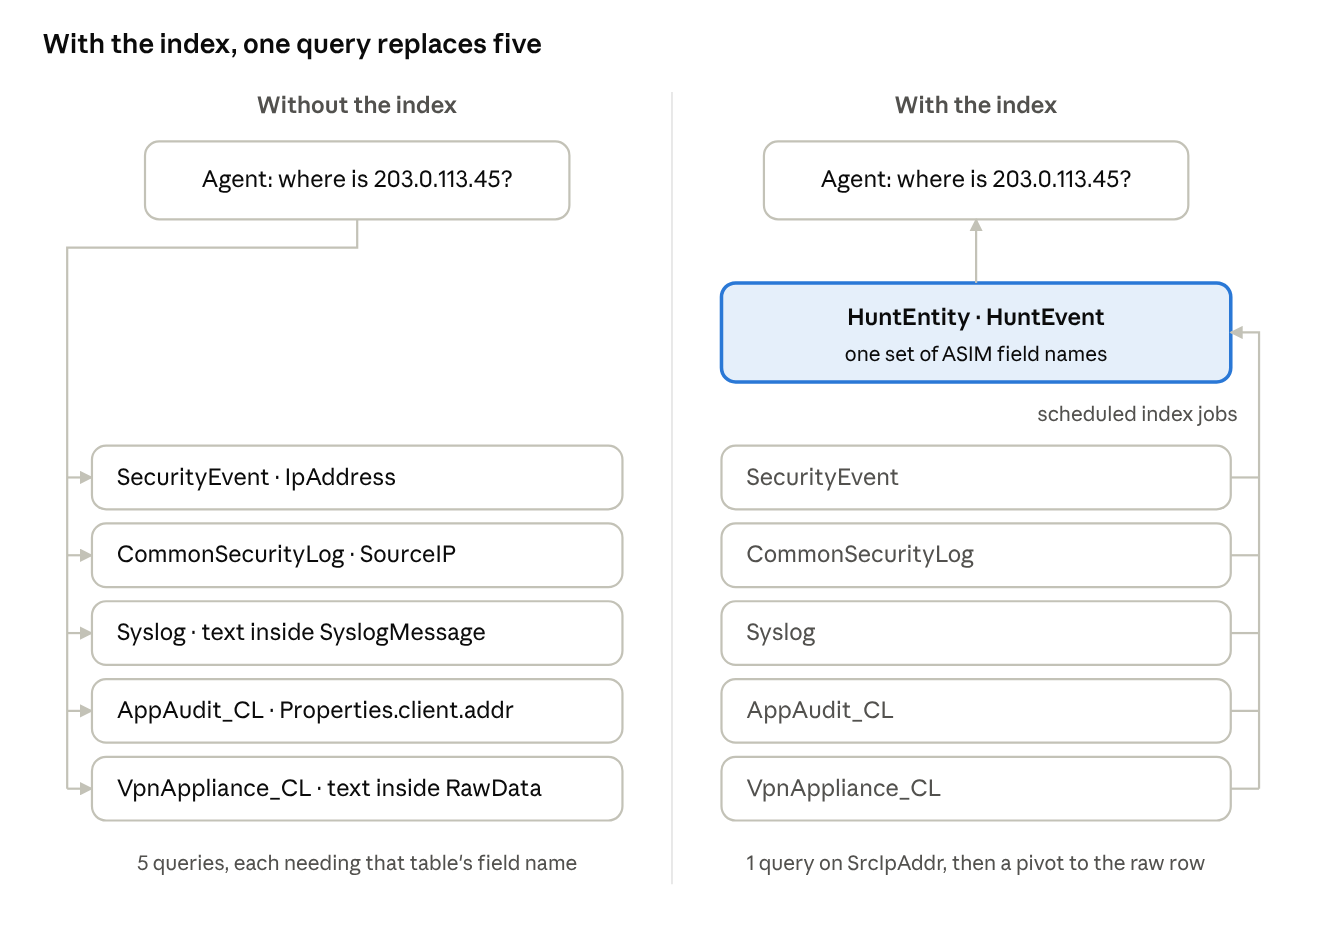
Every row in both tables names the source table and hour and keeps a few sample record keys that point back to the original records. The agent searches the index, then pivots to the raw rows when it needs the full detail.

With the index, one query replaces five

HOW TO READ IT

On the left, the agent must query each table with that table’s own field name, and two of the five hide the IP in free text. On the right, scheduled jobs (the line on the far right) feed every source into the index ahead of time, and the agent asks a single question of it.

02
02 /

Four ways a source gets mapped

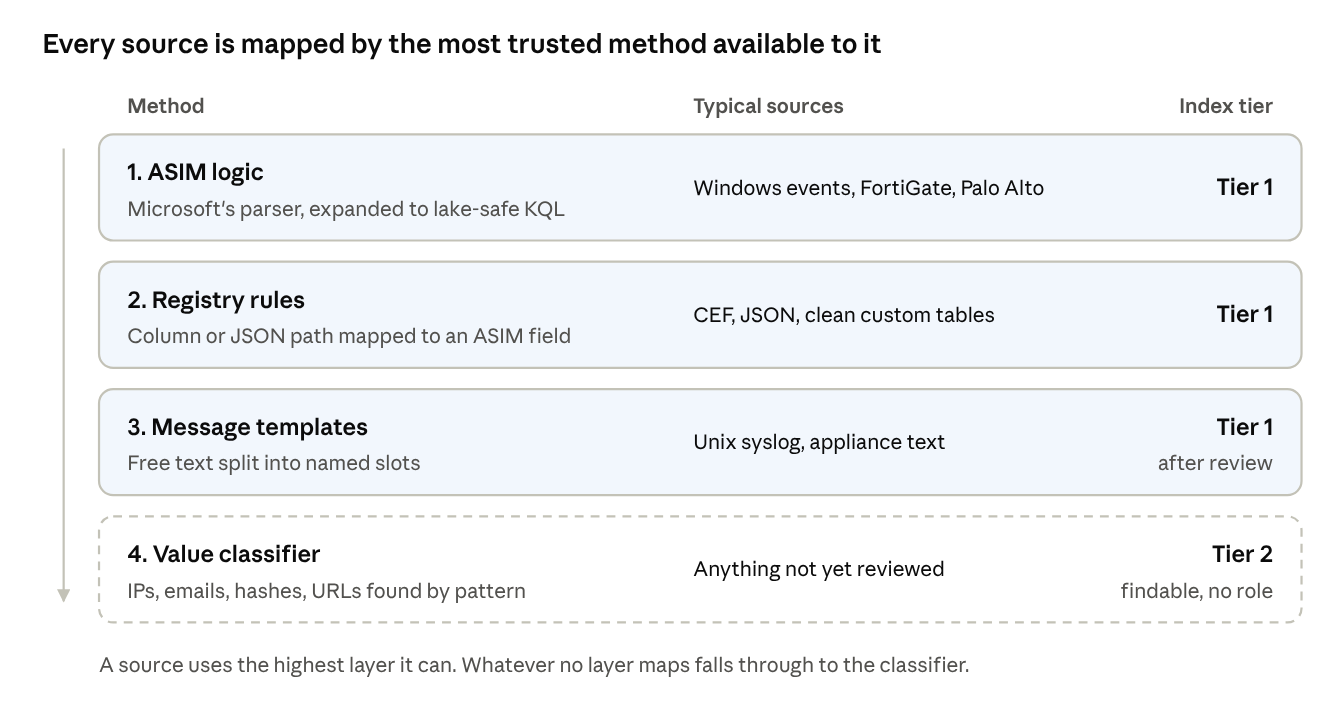
No single method covers hundreds of sources, so the index uses four, in order of trust. Each source uses the best one available to it, and each index row records which one produced it.

01
ASIM logic
Where Microsoft ships an ASIM parser, its KQL is expanded into a lake-safe query (no stored functions) and runs as a job. This gives the same fields ASIM would.
02
Registry rules
For structured sources with no parser (CEF, JSON, clean custom tables), a short mapping in a Git registry says which column or JSON path holds which ASIM field.
03
Message templates
For free text such as Unix syslog, a notebook groups messages into templates by masking the variable parts. An analyst names the slots once, for example “Failed password for <user> from <ip>”. An approved template then runs as KQL.
04
Value classifier
Anything left over is scanned for values that look like IPs, emails, hashes or URLs. These rows are findable but carry no role, so they are marked as a lower tier.
Every source is mapped by the most trusted method available to it

HOW TO READ IT

Top to bottom is most trusted to least. The middle column shows the kinds of sources each method suits; the right column is the tier the index records, which the agent uses to weigh a result. The dashed band catches whatever the other three miss.

The result is that every source is searchable on day one, and the mapping gets better as sources are reviewed.

03
03 /

The architecture

Everything runs inside the Sentinel data lake. There are no new data connectors, DCRs or ingestion changes: the index is built from data already there.

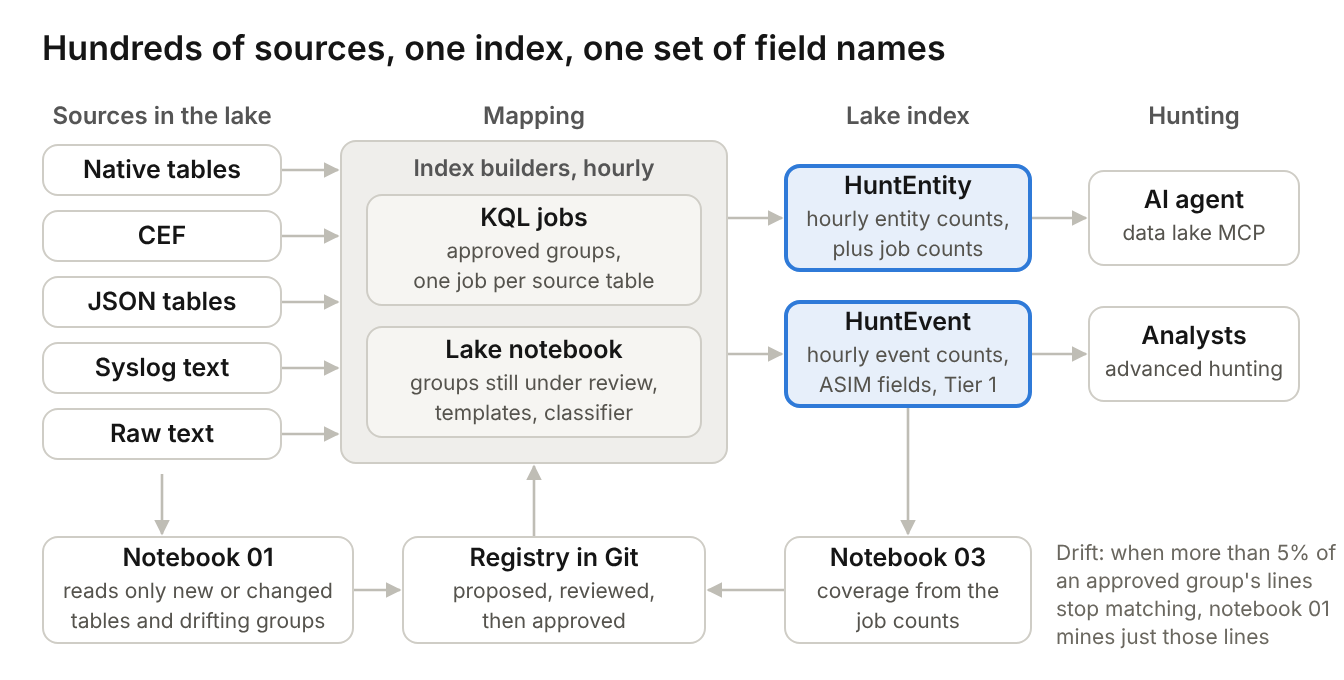
The index builders are of two kinds. KQL jobs run every approved mapping: ASIM logic, registry rules and approved message templates. A lake notebook handles the sources nobody has reviewed yet. The notebook is Python for Spark (PySpark), written as a Jupyter notebook in Visual Studio Code with the Microsoft Sentinel extension, that reads lake tables and writes its results back to the lake. KQL jobs and notebooks can both run on a schedule, so once a source is approved nobody runs anything by hand.

Three scheduled notebooks do the work that would otherwise be manual:

  • Notebook 01 runs daily. It reads only new tables, changed schemas and the lines no template matched, profiles each field (how often it is filled and what its values look like) and proposes ASIM names, roles and message templates for an analyst to review. Sources with approved, high-confidence mappings are skipped.
  • Notebook 02 runs hourly on sources nobody has reviewed yet. It indexes them through the value classifier into the same two tables the KQL jobs write, so they are searchable from day one. Once a source is approved, its mapping moves into a KQL job and the notebook stops reading it.
  • Notebook 03 runs daily. It builds the coverage report from counts the index jobs record as they run (rows read, rows with an entity, rows matching a template) and flags any source whose extraction rate drops, which usually means the vendor changed its log format. It reads no source data.

A mapping is decided once. After approval, the only recurring work for a source is applying its mapping to each new hour of events in a KQL job; nothing already indexed is read again. Analysts approve mappings and check results. Finding new fields, building the index and catching format changes all run on a schedule.

Hundreds of sources, one index, one set of field names

HOW TO READ IT

The top row runs left to right. Source tables of every shape feed the index builders. Approved groups run in one KQL job per source table; only groups still under review run in the lake notebook. Both write the two index tables that the agent and analysts query: HuntEntity holds hourly entity counts plus each job’s row counts, and HuntEvent holds hourly counts of Tier 1 events with ASIM field names. Every index row carries sample record keys, so a hit is one pivot from the raw events. The bottom row is the control loop: notebook 01 reads only new or changed tables and drifting groups and proposes mappings, analysts approve them in the registry, the registry generates the builders, and notebook 03 measures coverage from the job counts. The note on the right is the drift rule that sends an approved group back to notebook 01.

04
04 /

One question, five sources

The example below uses sample data from five sources with very different shapes: Windows security events, FortiGate firewall logs over CEF, Linux sshd syslog, a JSON audit table from an in-house app, and a VPN appliance that writes raw key=value text. The agent asks one question: where has 203.0.113.45 appeared?

Source How it was mapped Role Result
Windows SecurityEventASIM logicSourceFailure
FortiGate (CEF)ASIM logicSourceFailure (deny)
Linux sshd (Syslog)Message templatesSourceFailure, 2 events
App audit (JSON)Registry rulesSourceFailure
VPN appliance (raw text)Classifier, then templates after reviewSourceFailure

One query over the index found the address in all five, each time labelled as the source, with a failed or denied result. Asked for the same user’s sign-ins, the index returns four failures from that address within about a minute, then successes from an internal address 16 minutes later. Without the index, the agent would need five different queries and would have to know each table’s field names.

05
05 /

Adding a new source

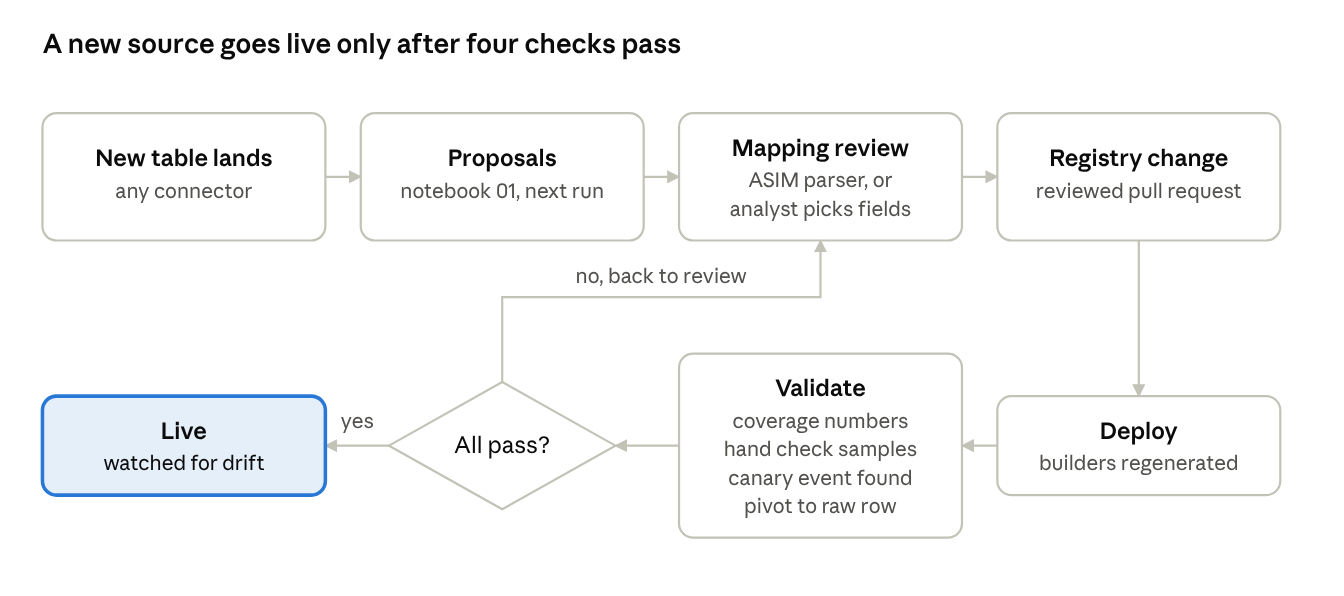
Once the index is running, a new log source needs a mapping review, not a new pipeline. The new table is searchable through the classifier from its first indexing run, before anyone has looked at it.

A new source goes live only after four checks pass

HOW TO READ IT

The top row runs left to right, then the flow turns down at the registry and runs right to left. Review starts from the parser if Microsoft ships one, otherwise from the fields and templates notebook 01 proposes. After deployment, four checks run: coverage numbers in the coverage table, a hand check of sample rows, a known test event found through the agent, and a pivot back to the raw row. Any failure sends the source back to review.

06
06 /

Walkthrough demo and video

The daily workflow can be seen in two places. Both use synthetic data only: documentation IP ranges, private 10.x addresses and contoso.com names.

  • Walkthrough demo: an 18-step guided tour that runs in the browser with no server. Notebook 01 checks new and changed sources and proposes fields for a new badge reader table, an analyst reviews them, an admin approves the change, the generated lake job is deployed and passes four validation checks, a vendor format change is fixed, and a hunt for 203.0.113.45 runs across ten source groups.
  • Demo video: about three minutes, recorded from the Lake Hunt app in demo mode. It covers the architecture, onboarding the badge reader, approval, validation and the same hunt.
07
07 /

Cost at 1 TB a day

At 1 TB a day of lake ingestion, the index adds about $440 to $490 a month on top of the lake’s own cost for the raw data. That lake cost is about $6,080 a month at this volume: $4,500 to ingest it ($0.05 per GB ingestion plus $0.10 per GB data processing) and $1,580 to store it for a year. The index figure covers the hourly KQL jobs, the three notebooks and one year of storage for both index tables. Most of it is the KQL jobs, which read each new hour of data once. The notebooks cost under $150 a month because they only touch new, changed and unreviewed sources. The figures use Microsoft’s published Sentinel data lake prices in US dollars for East US. The full calculation and its assumptions are in the project’s GitHub repository, along with a walkthrough demo of the daily workflow.

08
08 /

Limits

  • The index covers common hunting fields: IPs, users, hosts, URLs, hashes, results and event types. Fields that only matter to one product stay in the raw table, one pivot away.
  • Index freshness follows the job schedule, hourly in this design. Real-time detection stays in the analytics tier.
  • Lake KQL jobs have tenant limits on count and concurrency, so sources are batched into shared jobs rather than one job per source.
  • The design has been deployed and run in a test tenant with the Sentinel data lake onboarded. Behaviour at production volume still needs confirming, including notebook run times and how the job limits apply at 1 TB a day.

The point of the design is that the cost of normalization is paid once per source, not once per hunt, and that an AI agent gets one consistent set of field names across every log source in the lake.

09 /

References

FIELD NOTES · TEST-TENANT DATA ONLY · SIMPLE-SECURITY.CA

Getting Started With Defender for IoT/OT

Pressure is increasing on manufacturers to monitor their shop floors in order to avoid major disruptions in supply chains. A recent example of such a risk is CVE-2023-3595. This vulnerability has a CVSS score of 9.8 (i.e., very bad).

It involves the use of CIP (Common Industrial Protocol). As such, you wouldn’t expect there to be your typical IOCs like IP addresses and hashes that you could add to your SIEM to detect this vulnerability. You would need to sniff your factory network, looking for malicious use of the CIP protocol. This is where OT security tools like Defender for OT come in. (Since we’re just talking about OT here I’m going to drop the IoT…)

Here’s a quick walkthrough to getting started with Defender for OT:

Getting Started with Defender for OT

  • Login to the Azure portal and search for Defender for OT and select ‘Set up OT/ICS Security’
  • Download the sensor and install the ISO in a hypervisor like Hyper-V or VMWare. (when setting up your VM, make sure to use at least 2 network interfaces – 1 for management and 1 for sniffing)
  • Connect the ‘sniffing’ network interface from your VM to a SPAN port on your network. If you’re just playing around with the sensor you can just have it sniff your home network or whatever is safe for you to monitor.
  • After the sensor installation you will be provided 3 unique credentials to login to the sensor’s web interface, so don’t lose those credentials.
  • Get a license – there’s a 60 day trial license here in the M365 admin center:
    https://learn.microsoft.com/en-us/azure/defender-for-iot/organizations/getting-started
  • Go back to the Azure portal and register your sensor. Once the sensor is registered it will give you a zip file which is the license key for that sensor.

How to Test Your Sensor:

  • Download some sample pcap files like from here: https://github.com/EmreEkin/ICS-Pcaps
  • Login to your sensor (https://<ip address of sensor>) with the username ‘cyberx’ and the password that was given to you during the sensor installation.
  • Go to System Settings > Play Pcap, and upload one of your sample pcap files.
  • After selecting ‘play all’, your sensor will begin analyzing your pcap traffic.
  • If nothing interesting is seen in the alerts tab you may need to create a custom alert to trigger some alerts. Some experience with network traffic analysis and Wireshark can be very useful.

Next Steps: Connect Defender for OT to Sentinel

  • Back in the Azure portal, go to the Content Hub and install the Defender for OT solution bundle.
  • Now go to Connectors and enable the Defender for IoT connector
  • Finally go to Analytics, search the templates for all of the OT rules and enable whatever you like.
References:
https://learn.microsoft.com/en-us/azure/defender-for-iot/organizations/ot-deploy/install-software-ot-sensor

https://www.netresec.com/?page=PcapFiles

Cheat Sheet for Configuring Carbon Black Cloud (EDR) for Sentinel

(And a pretty good example of configuring ANY Sentinel data connectors that use APIs and Azure Functions.)

There are several ways to get data into Sentinel.

If your log source requires an API pull, it’s very likely that Sentinel will use an Azure Function app to pull the data.

Vendors have many uses for their APIs so you can’t assume that theirs was built just to please your SIEM.

As a result there is often a bit of a learning curve when trying to understand how to get API logs into Sentinel and how Azure functions play a role.

Here are the 3 basic steps for getting your API logs into Sentinel:

  • Spend some time to understand the vendor’s API – List out all of the available API options. For Carbon Black, there are over 15 APIs!!! But you need just 2 of them for Sentinel.
  • Collect the variables needed to configure the Azure Function – for Carbon Black there are about 15 variables!!! (see cheat sheet below). You’ll need the help of your friendly AWS admin as well as your Carbon Black admin.
  • Get familiar with how to troubleshoot a vendor’s API and Azure Functions – If you’re familiar with curl, wget and/or Postman, then you’re on your way, but that subject is out of scope for this article. For Azure Functions it’s mostly about being able to tweak your variables and how to monitor the output logs (see cheat sheet below).

My cheat sheet for Sentinel Carbon Black Cloud (EDR) Connector

Converting this cheat sheet from Excel to fit in this blog is beyond my skills, so I’ve attached a pdf version.

I’m confident that if you can configure Carbon Black Cloud, you’ll probably have no issue with most other Azure Function API connectors for Sentinel.

I doubt any other connectors will have this many variables!

Addendum: Which audit logs should I collect?

When configuring this connector, there are 4 check boxes to choose from. Here ‘s a brief explanation for them:

CB Alerts Only:
If you just need the CB alerts, then just check off ‘Alert – supported with SIEM API credentials’. This is a good starting point since you don’t have to worry about connecting to AWS.

CB Alerts with All Events
If you need all of the events associated with the alerts, then check off these 2:
Event – supported with aws s3 bucket credentials
Alert – supported with aws s3 bucket credentials
And then proceed to set up an s3 bucket along with everything else.

Audit
These are just basic Carbon Black audit logs, no alerts/events here.
And no need for s3 buckets so enable it with no difficulty.

US National Cybersecurity Strategy

Based on the recent publication of the US National Cybersecurity Strategy, here are some practical suggestions for implementing cybersecurity solutions that loosely map to its guidelines:

  1. Defend Critical Infrastructure by:
  • Expanding the use of minimum cybersecurity requirements in critical sectors to ensure national security and public safety and harmonizing regulations to reduce the burden of compliance

Recommendation: Perform a gap analysis on your cybersecurity defenses. Start with a ‘master list of all recommended defenses and compare that to your organization’s tools’ Prioritize the implementation of any required defenses. Consider consolidation of security solutions under a single vendor’s licence agreement to save on costs. Create good architecture diagrams to describe your infrastructure from a cybersecurity perspective.

  • Enabling public-private collaboration at the speed and scale necessary to defend critical infrastructure and essential services

Recommendation: Create an inventory of all critical assets. If you’re a small org then a manual inventory is fine, otherwise consider a mature asset collection tool to help with this (google ‘asset inventory cybersecurity’ and you’ll get plenty of hits). Use your asset inventory to categorize critical assets and use this information in your SIEM to help with better correlations.

  • Defending and modernizing Federal networks and updating Federal incident response policy.

Recommendation: Review/create incident response policies and procedures. Consider creating specific response procedures that map to your SIEM incidents to improve clarity and incident response times.

  1. Disrupt and Dismantle Threat Actors by:
  • Using all instruments of national power, making malicious cyber actors incapable of threatening the national security or public safety of the United States
  • Strategically employing all tools of national power to disrupt adversaries
  • Engaging the private sector in disruption activities through scalable mechanisms
  • Addressing the ransomware threat through a comprehensive Federal approach and in lockstep with international partners.

Recommendation: Have a clear understanding of the ‘kill chains‘ that may affect your organization. Use Mitre ATT&CK  and your favorite security sites to help research threat actor groups. Identify security tools needed to detect/block attackers. Test/validate the effectiveness of those tools using Red/Blue/Purple team events.

  1. Shape Market Forces to Drive Security and Resilience by:
  • Placing responsibility on those within the digital ecosystem that are best positioned to reduce risk and shift the consequences of poor cybersecurity away from the most vulnerable in order to make the digital ecosystem more trustworthy
  • Promoting privacy and the security of personal data

Recommendation: Move data to the cloud and implement a data protection solution that not only tags and categorizes your data but locks out access if it’s stolen.

  • Shifting liability for software products and services to promote secure development practices
  • Ensuring that Federal grant programs promote investments in new infrastructure that are secure and resilient.
  1. Invest in a Resilient Future by: 
  • Reducing systemic technical vulnerabilities in the foundation of the Internet and across the digital ecosystem while making it more resilient against transnational digital repression

Recommendation: Implement a robust vulnerability assessment solution. Note that moving all your assets to the cloud can make this far easier to manage and can greatly benefit the effectiveness of your CSPM and SIEM.

  • Prioritizing cybersecurity R&D for next-generation technologies such as postquantum encryption, digital identity solutions, and clean energy infrastructure and developing a diverse and robust national cyber workforce.
  1. Forge International Partnerships to Pursue Shared Goals by:
  • Leveraging international coalitions and partnerships among like-minded nations to counter threats to the digital ecosystem through joint preparedness, response, and cost imposition
  • Increasing the capacity of partners to defend themselves against cyber threats, both in peacetime and in crisis; and working with allies and partners to make secure, reliable, and trustworthy global supply chains for information and communications technology and operational technology products and services.

Recommendation: Although many are reluctant to go back to the IBM days of putting all your security solutions into a single basket, cloud vendors and MSSPs have made great progress in the past 5+ years to provide a long list of services under one roof. When looking for one security product it’s very important to think broader and understand the interconnected values between all of your other security tools (XDR!). Security decision makers will often find that re-shuffling several of their security solutions makes more sense than just adding them one brick at a time.

SIEM Use Case Guide – Part 3

Real World Examples

In this section let’s take the real world example of Bloodhound and discuss defensive measures for that use case.

Bloodhound

Step 1: Know thy Enemy.

Have a good list of threat intelligence sites (eg Mitre) that you can use to learn about an attack group or a specific exploit. Bloodhound uses ‘ingestors’ like Sharphound to collect information which it then uses to map out an attack path. So when looking for defenses you may need to look at the ingestors, not Bloodhound itself (although Sharphound may run as a sub-command within Bloodhound).

Step 2: Plan your defenses and build a Blue Team toolkit.

There are many ways to detect and block an exploit, depending on the conditions. But don’t take too much time thinking about the best way to do it when there are some easy wins that you can do right away, for example:

  • Ensure an EDR (and AntiMalware) is installed on all endpoints, and run reports to ensure their rules/signatures are all kept updated.
  • If the EDR vendor provides advanced features, make sure they’re enabled for optimal defenses – eg. enable blocking mode, enable advanced configurations such as Microsoft Defender ASR (Attack Surface Reduction)
  • Configuration Policies – Use tools like Microsoft Endpoint Manager (with Intune) to configure policies on your endpoints to provide a base ‘hardening’ for your devices. Ensure logging is enabled on all servers, including advanced logging for Powershell. If you’re using 1 or more cloud platforms you should be managing your infrastructure’s security policies with a CSPM (cloud security posture management) like Microsoft Defender for Cloud – this can also add additional defenses like FIM – File Integrity Management.

Step 3: Build Process For Faster Response

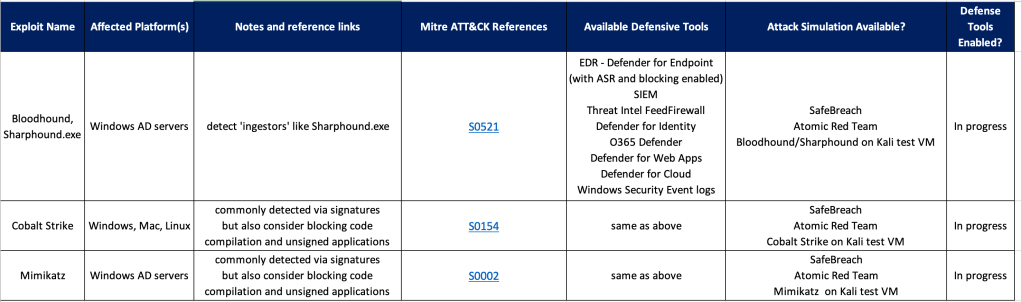
Once you have a list of tools/methods for building defenses, create a checklist and start filling it out. You’ll find that after adding a few rows a common pattern will arise for similar exploits, so your ‘Defender’ job should get a bit easier over time.

Example Defender Framework/Checklist

See also:

Making Security Fun with Microsoft Cloud Games

This is a really fun way to learns some practical skills with Microsoft Cloud security tools.

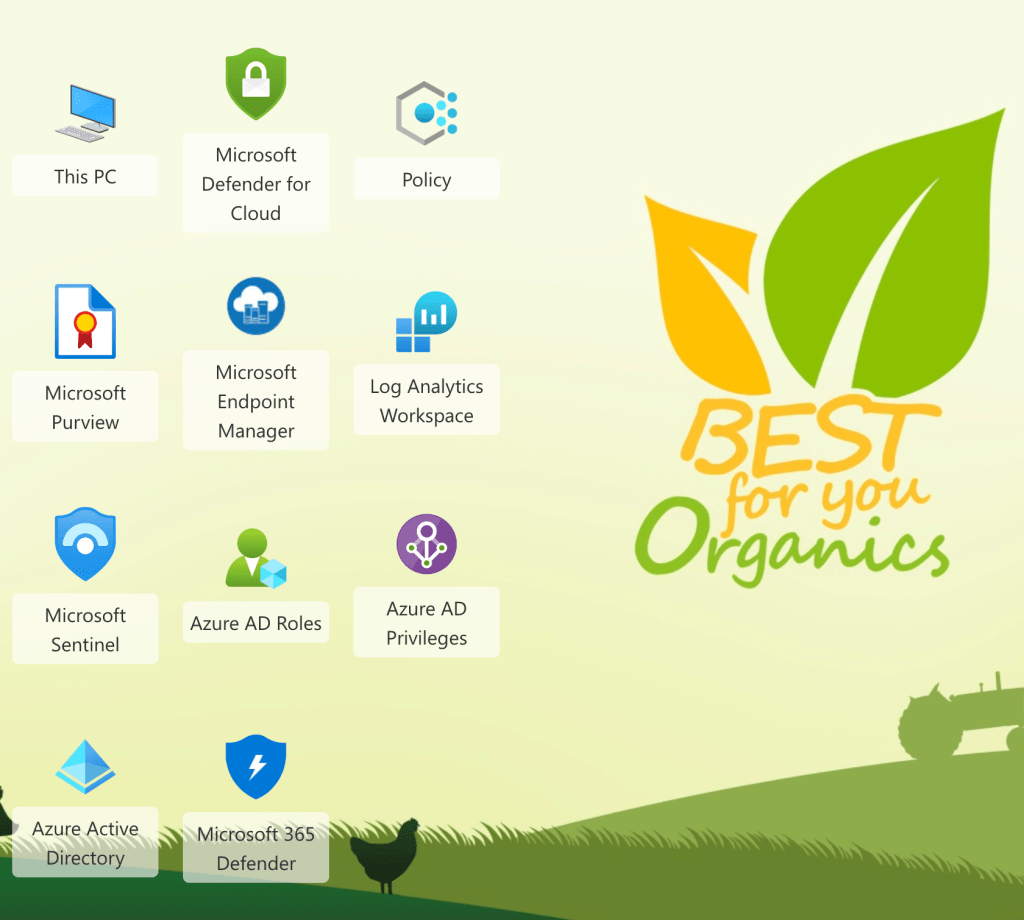
I would recommend this for anyone who has a Microsoft E5 license or anyone using Microsoft cloud based products who is ready to get serious about securing their cloud and on-prem environment with Microsoft security tools.

This is not for beginners.

It’s expected you have at least a basic understanding of what these security tools are shown in this screenshot from the game:

Expect to spend at least a couple of hours playing the game.

Have fun!

Mapping Cyber Defense Use Cases to Mitre ATT&CK Data Sources

Mitre ATT&CK provides so many ways to quantitatively think about approaches for defending against attackers.

However it can be challenging to map the ATT&CK matrix to to real-world defense methods.

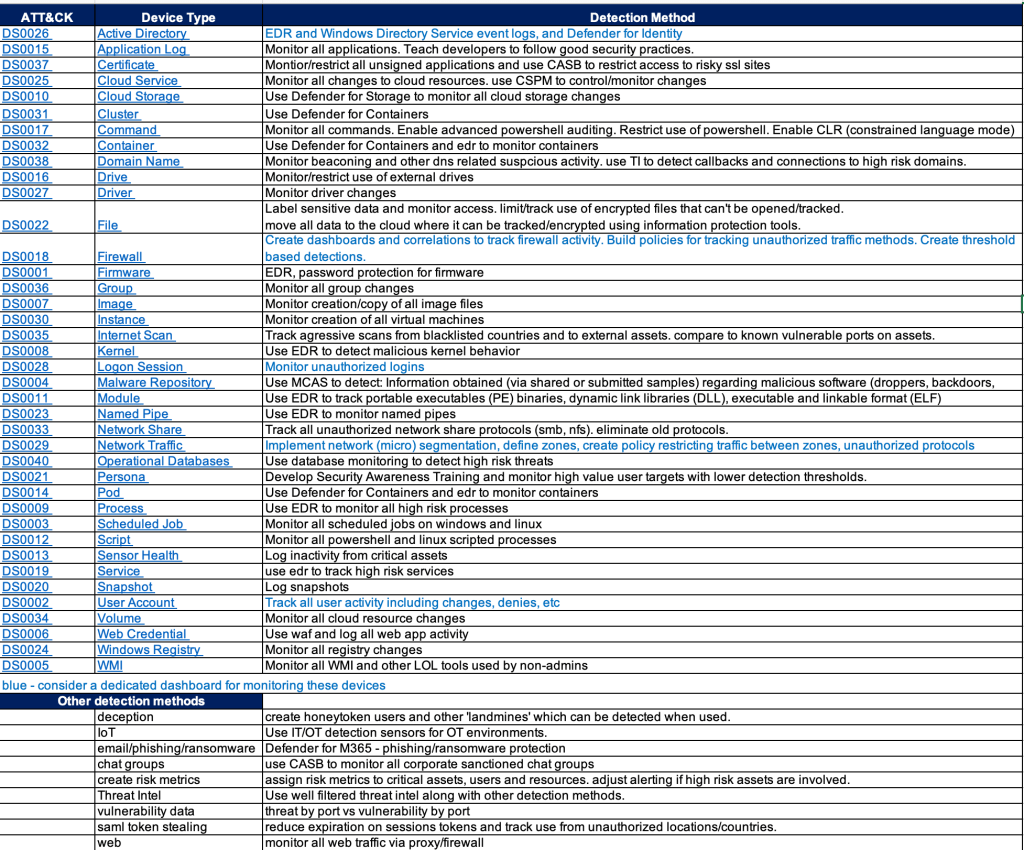
One approach is to look at the ATT&CK data sources and research detections that would map to those data sources.

This still requires some experience and a bit of guessing since there doesn’t appear to be an easy button way to map data sources to detection tools.

Endpoint Detection vendors have done a pretty good job mapping detections to ATT&CK techniques but few of them share their mappings in a simple spreadsheet – that would greatly help validate your detection gaps.

SIEM products like Microsoft Sentinel have done a good job mapping detection rules AND log sources to ATT&CK.

The chart below is an example of an easy way to provide a path forward on where to focus efforts for detections. It also provides a gap analysis for any obvious security tools that may be missing in your environment.

And hopefully my short detection method recommendations will give you some ideas or at least stir conversation.

Installing the Azure Arc Agent for Windows Event Collection(and more)

If your SIEM is Microsoft Sentinel, then you likely need to collect Windows security events.
If you’ve never heard of ‘Arc’ then you’re likely collecting Windows logs using the legacy ‘Log Analytics Agent (Microsoft Monitoring Agent)’.
Microsoft recommends using the Azure Arc agent, along with the Azure Monitoring Agent, which will get push out automatically once configured in Arc, or Azure Monitor, or Sentinel.

The Arc agent extends the security controls you normally only get from cloud servers to your on-prem servers, and simplifies the number of agents needed for on-prem servers to work with Azure.

A discussion about Arc/CSPM/Azure Policy/Defender for Cloud/Asset Inventory/Attack Surface is out of the scope of this article, but trust me, you want to use Arc for all your on-prem windows and linux servers.

Prerequisites for Arc:

  • Local admin access to the on-prem windows/linux server
  • Global Admin access to Azure
  • On-prem server must have Internet access or a direct connection to Azure.
  • Sentinel Log Analytics Workspace

ARC agent installation:

Azure Monitor Agent (AMA) Installation

  • You actually don’t need to install AMA.
  • You configure a ‘Data Collection Rule’ in Sentinel or Azure Monitor with the preferred parameters, and this will enable the AMA as an ‘Arc Extension’

Sentinel Connector AMA Setup

  • Since most of the topics in this blog are around Sentinel, that will be the configuration discussed here.
    • You can also configure this in Azure Monitor and in Azure Arc, but the data might not then be accessible as easily in Sentinel (it may get stored in the Events table vs the SecurityEvents table – see references below)
  • In Sentinel go to: Connectors > “Windows Security Events via AMA”
  • Create a ‘Data Connection Rule (DCR)’:
    • Add your servers
    • Select the ‘Common’ filter – this is the best choice for all of the Security Events.
  • After a few minutes you should see your on-prem security events in the SecurityEvents table.

References:

https://docs.microsoft.com/en-us/azure/azure-monitor/faq#azure-monitor-agent

https://docs.microsoft.com/en-us/azure/azure-monitor/agents/azure-monitor-agent-windows-client

Blue Teaming – My Top 10 Solutions for a Successful SOC Defense Strategy

(in no particular order – includes both on-prem and cloud)

SIEM Attack Simulations and tuning
Configure test lab and simulate attacks to verify triggering of alerts

Active Defenses/Deception Techniques
Plan/Deploy/Test deception techniques

Use Case Catalog
Documented methodology for providing clear/concise implementation of SIEM use cases based on existing log sources and a focus on threat and compliance related detections.

SDLF – Security Data Logging Framework
Documented methodology for providing clear/concise implementation of log sources into SIEM for assured value. (perhaps I need to blog about this)

Cloud Diagnostic Checklist
Checklist of O365 and Azure security features to improve awareness of security features available with an E5 license.

Purple Teaming
Red/Blue teaming activity with a focus on improving awareness of SOC security best practices.

Attack Surface Mapping
Network and asset discovery discussions with a focus on attack surface mapping

EDR attack simulations
Setting up attack simulations for your EDR

SOAR Development
Creation of automated actions to both enhance SIEM alert details and provide automated actions as a result of a given incident.

Cloud Security Posture Planning and development
Planning and deployment of CSPM/CWPP