If your SIEM is Microsoft Sentinel, then you likely need to collect Windows security events. If you’ve never heard of ‘Arc’ then you’re likely collecting Windows logs using the legacy ‘Log Analytics Agent (Microsoft Monitoring Agent)’. Microsoft recommends using the Azure Arc agent, along with the Azure Monitoring Agent, which will get push out automatically once configured in Arc, or Azure Monitor, or Sentinel.
The Arc agent extends the security controls you normally only get from cloud servers to your on-prem servers, and simplifies the number of agents needed for on-prem servers to work with Azure.
A discussion about Arc/CSPM/Azure Policy/Defender for Cloud/Asset Inventory/Attack Surface is out of the scope of this article, but trust me, you want to use Arc for all your on-prem windows and linux servers.
Prerequisites for Arc:
Local admin access to the on-prem windows/linux server
Global Admin access to Azure
On-prem server must have Internet access or a direct connection to Azure.
Sentinel Log Analytics Workspace
ARC agent installation:
Portal > Azure Arc > Servers > +Add > Add a single server: Generate script
Select the Sentinel Resource Group and connectivity method=Public endpoint (if you don’t have an ExpressRoute or gateway)
Adding tags is recommended
Copy the provided script to the local server as runme.ps1 or whatever and run it from powershell: .\runme.ps1
You configure a ‘Data Collection Rule’ in Sentinel or Azure Monitor with the preferred parameters, and this will enable the AMA as an ‘Arc Extension’
Sentinel Connector AMA Setup
Since most of the topics in this blog are around Sentinel, that will be the configuration discussed here.
You can also configure this in Azure Monitor and in Azure Arc, but the data might not then be accessible as easily in Sentinel (it may get stored in the Events table vs the SecurityEvents table – see references below)
In Sentinel go to: Connectors > “Windows Security Events via AMA”
Create a ‘Data Connection Rule (DCR)’:
Add your servers
Select the ‘Common’ filter – this is the best choice for all of the Security Events.
After a few minutes you should see your on-prem security events in the SecurityEvents table.
Here are some thoughts on SIEM ‘Use Case Validation Testing’.
Most of the time I work with SIEMs that have decent out of the box rules/correlations, so you can match the available log sources to the available correlations and you’re basically done.
Occasionally I’ll be asked to validate the correlations through some sort of testing process.
This works fine for old-school detections and basic compliance rules, where it’s easy to have the customer perform some action like 3 login denies to trigger a matching correlation.
However it’s not so easy to say “perform a Teardrop and a Hafnium attack”, so specific threat based attack simulations are not practical.
So here’s an outline for how to approach SIEM rule validation:
List out the high level ‘tactics’, using MITRE or just a simpler list to get things started. Remember these tests must be associated with your available log sources eg:
Authorizations – password spray against a domain controller – using Active Directory or Azure AAD logs.
Threat – triggering a virus detection – using Microsoft Defender for endpoint
Keep adding to this list based on: <tactic> <available log source>
Try to provide at least one test for each available log source and grow from there.
Note that some log sources may not be use for correlations, but as investigative evidence for post-detection analysis.
Now that you have a list of detections, you need a ‘toolkit’ of methods for performing your attack simulations. Consider these:
Create a lab space
Many of these attack simulations should not be performed on production systems! A lab space provided the freedom to experiment more freely without the risk of doing harm.
Purple Teaming
Hire a pro and do end to end validations.
This approach helps educate your entire SOC/blue team on how the correlations work and how to tune them for appropriate detections.
It may also include a Compliance and/or MITRE APT planning session to map your correlations to appropriate controls.
Make sure you have rules in your SIEM to detect your attack simulations.
Active Defenses
Configuring ‘cyber deception‘ within your network is a good way to make your red teamers cry. Simply having some user accounts enabled (with no login privileges) is enough to trigger an alarm in your SIEM when someone tries to login with it.
Simply create some user accounts, spread around some files and start playing minesweeper with your red team (DJ I can’t get minesweeper out of my articles after you mentioned it).
So SIEM use case validation testing is an excellent task for all cybersecurity teams, but it does require some effort and coordination between all of your security teams – often more than the initial SIEM setup itself.
With the passing of ‘Cyber Deception Day’ (appropriately held on April 1) there’s been some resurgence of interest in cyber deception tools and techniques (also known as ‘active detection‘).
My approach:
Know your enemy: Research Mitre ATT&CK to identify techniques used by your adversaries.
Deceive your enemy: Use Mitre D3FEND to learn techniques to defend against your adversaries using deception techniques.
Detect your enemy: Apply defensive tools/methods to detect and respond to the deception triggers you’ve laid out (endpoint detection, os and cloud event logging, SIEM, SOAR)
Here are some ideas for ways to add ‘deceptions’ to your network w/o having to jump into a pro solution (I’m not against $$ but I suggest that as a next step)
Note: most of these suggestions imply a “landmine” approach – i.e. don’t worry about clever deceptions, start with just triggering alarms on things people shouldn’t be touching.
If you want to get to the ‘high interaction level‘ of deception, you’ll probably need a professional product.
robots.txt – embed ‘breadcrumbs’ in common places where hackers will visit.
When you’re done with the homegrown stuff, and you’re ready to justify the need for a full-coverage and lower maintenance solution, here are some of the top product vendors for deception tools:
Monitoring an adversary’s movements as it relates to your organization.
Your SIEM likely contains a great deal of information which can be mapped by country. That’s all you need to get started with a dashboard to see at a high level how those countries – or adversaries – are affecting your organization’s security posture.
Start with creating dashboards for the following, using Russia as an example:
outside > in: top destination IPs/domains FROM Russia
inside > out: top ip/domain sources TO Russia
users associated with any Russian IPs/domains.
asset mapping by criticality associated with Russian IPs (this asset list is likely something you’d have to build, but hopefully you’re already maintaining a good asset list)
timeline graph – all activity from all sources by volume over time associated with Russian IPs/domains
Some SIEMs are better than others with mapping IPs/domains to a country. Here’s a query example for doing it in Microsoft Sentinel on WAF events using a geoip reference table:
let geoData =
materialize (externaldata(network:string,geoname_id:string,continent_code:string,continent_name:string,
country_iso_code:string,country_name:string,is_anonymous_proxy:string,is_satellite_provider:string)
[@"https://raw.githubusercontent.com/datasets/geoip2-ipv4/master/data/geoip2-ipv4.csv"] with
(ignoreFirstRecord=true, format="csv"));
let lookup = toscalar( geoData | summarize list_CIDR=make_set(network) );
AzureDiagnostics
| where Category contains "ApplicationGateway"
| where Message contains "Inbound Anomaly Score Exceeded"
|summarize by clientIp_s
| mv-apply list_CIDR=lookup to typeof(string) on
(
where ipv4_is_match (clientIp_s, list_CIDR) //== false
)
| join kind=rightouter (AzureDiagnostics | where TimeGenerated > ago(7d)) on clientIp_s
| join kind=leftouter
(
geoData
) on $left.list_CIDR == $right.network
|summarize count() by clientIp_s, country_name, hostname_s
|where clientIp_s <> ""
|order by count_ desc
| where country_name == "Russia"
| where count_ >= 10
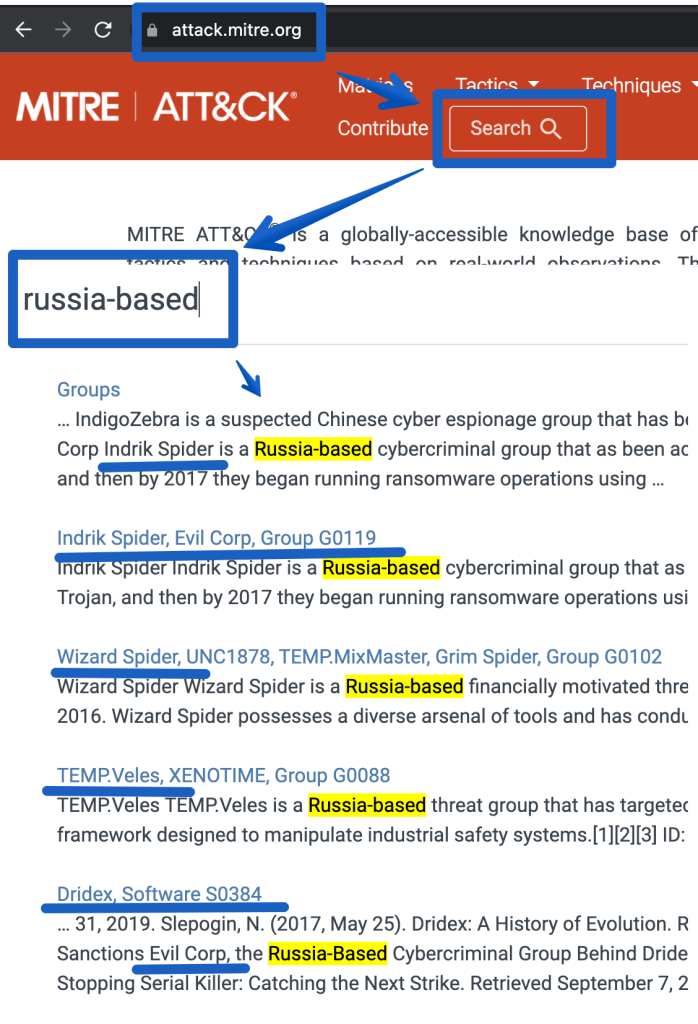
Next, research past history from attackers in that country. Go to Mitre’s ATT&CK site and search for the attack groups of interest:
The next step would be to go deeper and identify ‘entities’ that are specific to using these attacks, such as:
IP/domains from threat intel feeds
attacks/techniques that map to the above attack groups in the ATT&CK matrix. Click on the links above to see more details. (eg. T1059 – powershell scripting using Empire)
malware/endpoint (EDR) and network detections (proxy/nids/firewall) specific to the ATT&CK groups listed above. Many of these tools support ATT&CK mappings so with some luck you just have to create a list of the Mitre Technique numbers (eg. T1059) and you’re off.
Use the information above to create SIEM correlations. Add these alerts to your workbook/dashboard to show near real time detections as they are seen. Example correlations may include:
events mapping to a threat intel feed related to the adversaries in question
alerts related to 4 or more distinct Mitre Techniques in question.
EDR/IDS events mapping to the adversaries in question
malware NOT cleaned AND traffic to Russia or a known-bad-ip for the past 15 minutes.
SOAR example: create a playbook to map all alerts to APTs and TAG them as ‘MITRE APT: Russia’ use threat intel for the logic or another detection method)
Add metrics to your dashboard for management to see MTTD/MTTR (mean time to detect/respond).
Once the threat data is loaded you can use it in your alerting and kql searches, eg:
ThreatIntelligenceIndicator| where NetworkIP != “”
The Hard(er) Way
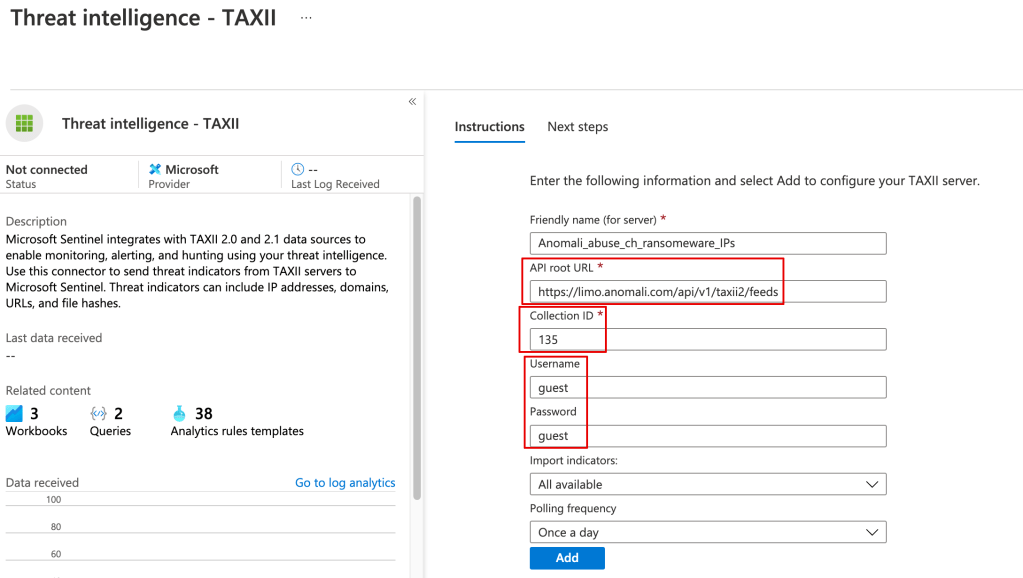
You can pull in the TI data from Anomali or any other TAXII server using a playbook.
Although there’s a learning curve around using playbooks (Logic Apps), they’ve very powerful, and you can do things like filter out undesired data from your TI feed before it’s stored in Sentinel.