Microsoft AMA Troubleshooter script

I recently had an issue with a new linux syslog server that was using Arc and had the AMA service enabled by a data collection rule in Sentinel.

I could see the Sentinel DCR (data collection rule) had been pushed out but the AMA agent wasn’t forwarding logs back up to Sentinel.

I suspected traffic was getting blocked but I wasn’t sure how to validate it.

This script will extract the Sentinel Workspace ID and perform a network connection test that simulates the connection from AMA to the data collection point or ODS(operational data store).

If the script fails, it means you need to talk to your firewall admin to open a connection to *.ods.opinsights.azure.com.

If you’re good at reading curl, you don’t need the script, just curl to
https://<workspaceid&gt;.ods.opinsights.azure.com

The script also checks the the AMA service is running and that you’re not out of disk space – 2 other common issues.

Have fun!

#!/bin/bash

# AMA Agent Validation Script
# Checks common issues with Azure Monitor Agent on Linux

set -e

RED='\033[0;31m'
GREEN='\033[0;32m'
YELLOW='\033[1;33m'
BLUE='\033[0;34m'
NC='\033[0m' # No Color

echo -e "${BLUE}=== Azure Monitor Agent Validation Script ===${NC}"
echo "Started at: $(date)"
echo

# Function to check endpoint connectivity
check_endpoint() {
    local url=$1
    local description=$2
    echo -n "Testing $description... "
    
    if curl -s --connect-timeout 10 --max-time 30 "$url" >/dev/null 2>&1; then
        echo -e "${GREEN}OK${NC}"
        return 0
    else
        echo -e "${RED}FAILED${NC}"
        return 1
    fi
}

# Function to check SSL handshake specifically
check_ssl_handshake() {
    local host=$1
    local description=$2
    echo -n "Testing SSL handshake for $description... "
    
    if timeout 10 openssl s_client -connect "$host:443" -servername "$host" </dev/null >/dev/null 2>&1; then
        echo -e "${GREEN}OK${NC}"
        return 0
    else
        echo -e "${RED}FAILED${NC}"
        return 1
    fi
}

# 1. Check AMA service status
echo -e "${BLUE}1. AMA Service Status${NC}"
if systemctl is-active --quiet azuremonitoragent; then
    echo -e "Service status: ${GREEN}RUNNING${NC}"
    echo "Service uptime: $(systemctl show azuremonitoragent --property=ActiveEnterTimestamp --value)"
else
    echo -e "Service status: ${RED}NOT RUNNING${NC}"
    echo "Try: systemctl status azuremonitoragent"
fi
echo

# 2. Check disk space
echo -e "${BLUE}2. Disk Space Check${NC}"
AMA_PATH="/var/opt/microsoft/azuremonitoragent"
if [ -d "$AMA_PATH" ]; then
    DISK_USAGE=$(df -h "$AMA_PATH" | awk 'NR==2 {print $5}' | sed 's/%//')
    if [ "$DISK_USAGE" -gt 90 ]; then
        echo -e "Disk usage: ${RED}${DISK_USAGE}% (CRITICAL)${NC}"
        echo "Free space needed in $(df -h "$AMA_PATH" | awk 'NR==2 {print $1}')"
        du -sh "$AMA_PATH/events"/* 2>/dev/null | sort -hr | head -5
    elif [ "$DISK_USAGE" -gt 80 ]; then
        echo -e "Disk usage: ${YELLOW}${DISK_USAGE}% (WARNING)${NC}"
    else
        echo -e "Disk usage: ${GREEN}${DISK_USAGE}% (OK)${NC}"
    fi
else
    echo -e "${RED}AMA directory not found${NC}"
fi
echo

# 3. Extract endpoints from config
echo -e "${BLUE}3. Extracting Configured Endpoints${NC}"
CONFIG_DIR="/etc/opt/microsoft/azuremonitoragent/config-cache"
WORKSPACE_ID=""
ENDPOINTS=()

if [ -d "$CONFIG_DIR" ]; then
    # Extract workspace ID and endpoints
    WORKSPACE_ID=$(grep -r "ods.opinsights.azure.com" "$CONFIG_DIR" 2>/dev/null | head -1 | grep -o '[a-f0-9-]\{36\}\.ods\.opinsights\.azure\.com' | cut -d'.' -f1 || echo "")
    
    if [ -n "$WORKSPACE_ID" ]; then
        echo "Workspace ID: $WORKSPACE_ID"
        ENDPOINTS+=("https://${WORKSPACE_ID}.ods.opinsights.azure.com")
    fi
    
    # Add standard endpoints
    ENDPOINTS+=(
        "https://global.handler.control.monitor.azure.com"
        "https://centralus.monitoring.azure.com"
        "https://management.azure.com"
        "https://login.microsoftonline.com"
        "https://ods.opinsights.azure.com"
    )
else
    echo -e "${RED}Config directory not found${NC}"
    # Use default endpoints
    ENDPOINTS=(
        "https://global.handler.control.monitor.azure.com"
        "https://centralus.monitoring.azure.com"
        "https://management.azure.com"
        "https://login.microsoftonline.com"
        "https://ods.opinsights.azure.com"
    )
fi
echo

# 4. Test endpoint connectivity
echo -e "${BLUE}4. Network Connectivity Tests${NC}"
failed_endpoints=0

for endpoint in "${ENDPOINTS[@]}"; do
    if ! check_endpoint "$endpoint" "$endpoint"; then
        ((failed_endpoints++))
    fi
done
echo

# 5. Test SSL handshakes for critical endpoints
echo -e "${BLUE}5. SSL Handshake Tests${NC}"
ssl_failed=0

if [ -n "$WORKSPACE_ID" ]; then
    if ! check_ssl_handshake "${WORKSPACE_ID}.ods.opinsights.azure.com" "Workspace ODS"; then
        ((ssl_failed++))
    fi
fi

if ! check_ssl_handshake "global.handler.control.monitor.azure.com" "Control Plane"; then
    ((ssl_failed++))
fi
echo

# 6. Check for recent AMA errors
echo -e "${BLUE}6. Recent AMA Errors (last 1 hour)${NC}"
if command -v journalctl >/dev/null; then
    error_count=$(journalctl -u azuremonitoragent --since "1 hour ago" | grep -i "error\|failed\|ssl handshake" -c || echo "0")
    if [ "$error_count" -gt 0 ]; then
        echo -e "Recent errors: ${RED}$error_count${NC}"
        echo "Recent SSL handshake failures:"
        journalctl -u azuremonitoragent --since "1 hour ago" | grep -i "ssl handshake" | tail -3
        echo "Recent disk space errors:"
        journalctl -u azuremonitoragent --since "1 hour ago" | grep -i "no space left" | tail -3
    else
        echo -e "Recent errors: ${GREEN}0${NC}"
    fi
else
    echo "journalctl not available"
fi
echo

# 7. Check listening ports
echo -e "${BLUE}7. AMA Listening Ports${NC}"
if ss -tlnp | grep -q ":28330"; then
    echo -e "Port 28330 (syslog): ${GREEN}LISTENING${NC}"
else
    echo -e "Port 28330 (syslog): ${RED}NOT LISTENING${NC}"
fi
echo

# 8. System time check (critical for SSL)
echo -e "${BLUE}8. System Time Check${NC}"
current_time=$(date +%s)
ntp_time=$(curl -s "http://worldtimeapi.org/api/timezone/UTC" | grep -o '"unixtime":[0-9]*' | cut -d':' -f2 2>/dev/null || echo "$current_time")
time_diff=$((current_time - ntp_time))
time_diff=${time_diff#-}  # absolute value

if [ "$time_diff" -gt 300 ]; then
    echo -e "Time sync: ${RED}OUT OF SYNC (${time_diff}s difference)${NC}"
    echo "Current: $(date)"
    echo "Consider: ntpdate or chrony sync"
else
    echo -e "Time sync: ${GREEN}OK${NC}"
fi
echo

# Summary
echo -e "${BLUE}=== SUMMARY ===${NC}"
if [ "$failed_endpoints" -eq 0 ] && [ "$ssl_failed" -eq 0 ]; then
    echo -e "Overall status: ${GREEN}HEALTHY${NC}"
    echo "All endpoints accessible and SSL working correctly"
elif [ "$ssl_failed" -gt 0 ]; then
    echo -e "Overall status: ${RED}SSL ISSUES${NC}"
    echo "SSL handshake failures detected - check firewall/proxy settings"
    echo "Contact network team to whitelist Azure Monitor endpoints"
elif [ "$failed_endpoints" -gt 0 ]; then
    echo -e "Overall status: ${YELLOW}CONNECTIVITY ISSUES${NC}"
    echo "Some endpoints unreachable - check network connectivity"
else
    echo -e "Overall status: ${YELLOW}CHECK REQUIRED${NC}"
fi

echo
echo "Log locations:"
echo "  - AMA logs: journalctl -u azuremonitoragent"
echo "  - Config: /etc/opt/microsoft/azuremonitoragent/config-cache/"
echo "  - Events: /var/opt/microsoft/azuremonitoragent/events/"
echo
echo "Common fixes:"
echo "  - Disk space: Clean /var/opt/microsoft/azuremonitoragent/events/"
echo "  - SSL issues: Whitelist *.ods.opinsights.azure.com in firewall"
echo "  - Service: systemctl restart azuremonitoragent"

Linux AMA syslog agents: How to identify DCRs that are causing duplicate data collection

If you’re using the Microsoft AMA agent, you’re likely familiar with Data Collection Rules.

This tip is specifically for AMA agents installed on linux servers for the purpose of collecting syslog data.

It’s pretty easy to create 2 or more DCRs that overlap in their logic and result in collecting duplicate data. A common example is to get duplicate syslog data showing up in both the Syslog and CommonSecurityLog tables.

It can be difficult to read through all of your DCRs to find the duplicate configuration.

One approach to fixing this issue is to login to your server where the AMA agent is installed and look at the json files under:

/etc/opt/microsoft/azuremonitoragent/config-cache/configchunks/

Each json file represents a single Data Collection Rule. Here’s an example. Pay attention to the value following “agentConfigurations/dcr-<some alphanumeric>”

You’ll need that value to trace back to the DCR configuration in the Azure portal.

Now go to the Azure Portal and open the Resource Graph Explorer:

Run this query to get a list of your DCRs and their associated “dcr-xxx” values:

resources
| where type == 'microsoft.insights/datacollectionrules'
|extend immutableId = properties.immutableId
|project name, immutableId

Once you’ve identified a DCR you can simply delete it and after a few minutes you will see the .json file disappear from your AMA’s /configchunks/ directory.

Restarting the AMA agent might speed up the process of the json file being removed:

systemctl restart azuremonitoragent

or:

cd /var/lib/waagent/Microsoft.Azure.Monitor.AzureMonitorLinuxAgent-<agent version>
./shim.sh -disable
./shim.sh -enable

ls /etc/opt/microsoft/azuremonitoragent/config-cache/configchunks/*.json

Configuring the ‘NEW’ AMA (and Arc) agent to forward syslog to Sentinel

(Note: I have an older blog on this topic but based on new insights this article supersedes the old one)

Microsoft has already labeled the old ‘OMS’ syslog collector agent as legacy, so it’s important to think about switching to the new AMA agent.

If you have the word ‘syslog’ stuck in your brain you might think that in order to configure syslog you’d go into the Sentinel data connectors and search for ‘syslog’ – don’t do this.

The procedure for getting syslog into Sentinel is a bit different for VMs that are in Azure vs on-prem.

I’ve tested the recommendations below with the latest versions of Redhat And Ubuntu, on both on-prem VMs and in Azure.

For Azure VMs:
Create a DCR and configure your syslog facilities. Done..

– Note that a DCR is a Data Collection Rule. This is a fairly new way to define what data needs to be collected. It somewhat hides the underlying method of collection – eg. you tell it to collect syslog from a list of servers in scope, and it takes care of communicating with the AMA agent to make it happen.

– In Sentinel, you don’t need to do anything! The DCR points the data to the servers in scope and the log analytics workspace.

For an on-prem VM
– Just make sure you install the Arc agent first, then create your DCR for syslog, just like for the Azure VM. Done!

A very simple test:

On your linux server, ssh in and type “logger testing123”

In Sentinel > Logs, type “search testing123” . You will see your logs show up in the Syslog table in about 5-10 minutes, depending on when you pushed out your DCR.

(TIP: If you don’t see your logs in Sentinel but you see them with tcpdump, then check your firewall rules, eg. by default RedHat7 will block incoming syslog)

To check if your logs are event getting to your syslog server use tcpdump eg:
tcpdump -i any port syslog -A -s0 -nn

And note that you could be seeing your logs with the above tcpdump command but they’re still not getting to Sentinel. In that case check if the local firewall rules are blocking syslog.

If you need to troubleshoot the actual AMA agent on linux (or windows), there’s a script for that here.

What about CEF Logs?

If you need to collect CEF formatted syslog then you will need to go into Sentinel > Data Connectors – and search for “Common Event Format (CEF) via AMA (Preview)”. There’s a script in here you’ll need to run for both your Azure VMs and your on-prem linux VMs/servers.

The AMA/CEF script is commonly used for when you are trying to collect CEF logs from somewhere like PaloAlto firewalls and you want to forward them into Sentinel.

After installing the CEF forwarder script, create a DCR to forward the logs to Sentinel’s workspace. MAKE SURE YOU CREATE THIS DCR from Sentinel> Data Connectors CEF Via AMA. This will provide a special CEF configuration with the string ‘SECURITY_CEF_BLOB’ inside a json file located at /etc/opt/microsoft/azuremonitoragent/config-cache/configchunks/nnn.json. If this configuration doesn’t exist, your CEF data will only be forwarded to the Syslog table, not the CommonSecurityLog table.

Tip: Don’t use the same ‘syslog facility’ for CEF as you use for syslog or you may get log duplications. eg. if you use ‘user.info’ for CEF, don’t use it for your ‘regular’ syslog DCR.

There’s a great troubleshooter script for CEF:

Read this or jump the bottom of the page and run the troubleshooter:


sudo wget -O sentinel_AMA_troubleshoot.py https://raw.githubusercontent.com/Azure/Azure-Sentinel/master/DataConnectors/Syslog/Sentinel_AMA_troubleshoot.py &&sudo python sentinel_AMA_troubleshoot.py

Don’t get this confused with the ‘old’ CEF troubleshooter that was created for the OMS agent.

After running all of the troubleshooting tests, go to the Sentinel logs and look for the ‘MOCK’ test logs:

CommonSecurityLog
| where DeviceProduct == "MOCK"

If you need to run the MOCK test manually, here’s the command (sometimes the troubleshooting script doesn’t catch the test log so you may need to run it in another terminal session while running the script):


echo -n "<164>CEF:0|Mock-test|MOCK|common=event-format-test|end|TRAFFIC|1|rt=$common=event-formatted-receive_time" | nc -u -w0 <YOUR IP ADDRESS> 514

Another tip: Keep the /var mount point separate from root and give it about 500GB of disk space just for /var. Keep an eye on your disk space and increase this if necessary.

Another tip: There’s no need to keep the incoming syslog data in /var/log, so disable any default filters in /var/log/syslog.d/* that would store data there. The AMA agent will queue the data it needs in /var/opt/microsoft/azuremonitoragent/events/user.info and clear it out daily or sooner. If you don’t disable these default filters you may need to double the disk you need for /var.

References:

https://learn.microsoft.com/en-us/azure/sentinel/forward-syslog-monitor-agent

https://learn.microsoft.com/en-us/azure/sentinel/connect-cef-ama

Cheat Sheet for Configuring Carbon Black Cloud (EDR) for Sentinel

(And a pretty good example of configuring ANY Sentinel data connectors that use APIs and Azure Functions.)

There are several ways to get data into Sentinel.

If your log source requires an API pull, it’s very likely that Sentinel will use an Azure Function app to pull the data.

Vendors have many uses for their APIs so you can’t assume that theirs was built just to please your SIEM.

As a result there is often a bit of a learning curve when trying to understand how to get API logs into Sentinel and how Azure functions play a role.

Here are the 3 basic steps for getting your API logs into Sentinel:

  • Spend some time to understand the vendor’s API – List out all of the available API options. For Carbon Black, there are over 15 APIs!!! But you need just 2 of them for Sentinel.
  • Collect the variables needed to configure the Azure Function – for Carbon Black there are about 15 variables!!! (see cheat sheet below). You’ll need the help of your friendly AWS admin as well as your Carbon Black admin.
  • Get familiar with how to troubleshoot a vendor’s API and Azure Functions – If you’re familiar with curl, wget and/or Postman, then you’re on your way, but that subject is out of scope for this article. For Azure Functions it’s mostly about being able to tweak your variables and how to monitor the output logs (see cheat sheet below).

My cheat sheet for Sentinel Carbon Black Cloud (EDR) Connector

Converting this cheat sheet from Excel to fit in this blog is beyond my skills, so I’ve attached a pdf version.

I’m confident that if you can configure Carbon Black Cloud, you’ll probably have no issue with most other Azure Function API connectors for Sentinel.

I doubt any other connectors will have this many variables!

Addendum: Which audit logs should I collect?

When configuring this connector, there are 4 check boxes to choose from. Here ‘s a brief explanation for them:

CB Alerts Only:
If you just need the CB alerts, then just check off ‘Alert – supported with SIEM API credentials’. This is a good starting point since you don’t have to worry about connecting to AWS.

CB Alerts with All Events
If you need all of the events associated with the alerts, then check off these 2:
Event – supported with aws s3 bucket credentials
Alert – supported with aws s3 bucket credentials
And then proceed to set up an s3 bucket along with everything else.

Audit
These are just basic Carbon Black audit logs, no alerts/events here.
And no need for s3 buckets so enable it with no difficulty.

Configuring Sentinel to Collect CEF Syslog with the AMA agent

(NOTE: I suggest you read my new blog post on this topic here. Some of the suggestions below may be outdated)

Here’s a quick guide to installing the AMA agent for collecting syslog data into Microsoft Sentinel.

Note: the ‘legacy’ method involved installing the old OMS agent and a separate step for the CEF collection script. The new procedure only requires a single python script, but it also requires the Azure Arc agent.
(which arguably is an added benefit for many reasons we won’t get into here).

Note: the AMA agent relies on the Azure Arc agent, unless your syslog server is in the Azure cloud.

This procedure is using Ubuntu 20.04, but it will be almost identical for most other linux platforms:

  1. Install Python3 and other tools:
    • sudo apt-get update;sudo apt-get install python3;sudo apt-get install net-tools;sudo ln -s /usr/bin/python3 /usr/bin/python
  2. Install ARC agent. 
    • (if you haven’t done this before, go to the Azure portal and search for Arc.)
    • Verify: In the Azure portal, verify the server shows up in the list of Arc servers.
  3. In Sentinel, enable the CEF AMA connector and Create a DCR (data collection rule).
    • Enable these syslog Facilities: LOG_AUTH, LOG_AUTHPRIV and all of the LOG_LOCAL*. Use the log level of LOG_DEBUG.
    • WAIT 5 MINUTES for the Arc agent heartbeats to get up to Sentinel.
    • Verify: In the Sentinel log analytics workspace, query the ‘Heartbeat’ table – verify your arc server is here. 
  4. Install CEF AMA for syslog:

In Sentinel, verify the CEF logs are parsing by querying the CommonSecurityLog table:

References:

https://learn.microsoft.com/en-us/azure/sentinel/connect-cef-ama

https://learn.microsoft.com/en-us/azure/sentinel/forward-syslog-monitor-agent#configure-linux-syslog-daemon

https://learn.microsoft.com/en-us/azure/sentinel/data-connectors/common-event-format-cef-via-ama

US National Cybersecurity Strategy

Based on the recent publication of the US National Cybersecurity Strategy, here are some practical suggestions for implementing cybersecurity solutions that loosely map to its guidelines:

  1. Defend Critical Infrastructure by:
  • Expanding the use of minimum cybersecurity requirements in critical sectors to ensure national security and public safety and harmonizing regulations to reduce the burden of compliance

Recommendation: Perform a gap analysis on your cybersecurity defenses. Start with a ‘master list of all recommended defenses and compare that to your organization’s tools’ Prioritize the implementation of any required defenses. Consider consolidation of security solutions under a single vendor’s licence agreement to save on costs. Create good architecture diagrams to describe your infrastructure from a cybersecurity perspective.

  • Enabling public-private collaboration at the speed and scale necessary to defend critical infrastructure and essential services

Recommendation: Create an inventory of all critical assets. If you’re a small org then a manual inventory is fine, otherwise consider a mature asset collection tool to help with this (google ‘asset inventory cybersecurity’ and you’ll get plenty of hits). Use your asset inventory to categorize critical assets and use this information in your SIEM to help with better correlations.

  • Defending and modernizing Federal networks and updating Federal incident response policy.

Recommendation: Review/create incident response policies and procedures. Consider creating specific response procedures that map to your SIEM incidents to improve clarity and incident response times.

  1. Disrupt and Dismantle Threat Actors by:
  • Using all instruments of national power, making malicious cyber actors incapable of threatening the national security or public safety of the United States
  • Strategically employing all tools of national power to disrupt adversaries
  • Engaging the private sector in disruption activities through scalable mechanisms
  • Addressing the ransomware threat through a comprehensive Federal approach and in lockstep with international partners.

Recommendation: Have a clear understanding of the ‘kill chains‘ that may affect your organization. Use Mitre ATT&CK  and your favorite security sites to help research threat actor groups. Identify security tools needed to detect/block attackers. Test/validate the effectiveness of those tools using Red/Blue/Purple team events.

  1. Shape Market Forces to Drive Security and Resilience by:
  • Placing responsibility on those within the digital ecosystem that are best positioned to reduce risk and shift the consequences of poor cybersecurity away from the most vulnerable in order to make the digital ecosystem more trustworthy
  • Promoting privacy and the security of personal data

Recommendation: Move data to the cloud and implement a data protection solution that not only tags and categorizes your data but locks out access if it’s stolen.

  • Shifting liability for software products and services to promote secure development practices
  • Ensuring that Federal grant programs promote investments in new infrastructure that are secure and resilient.
  1. Invest in a Resilient Future by: 
  • Reducing systemic technical vulnerabilities in the foundation of the Internet and across the digital ecosystem while making it more resilient against transnational digital repression

Recommendation: Implement a robust vulnerability assessment solution. Note that moving all your assets to the cloud can make this far easier to manage and can greatly benefit the effectiveness of your CSPM and SIEM.

  • Prioritizing cybersecurity R&D for next-generation technologies such as postquantum encryption, digital identity solutions, and clean energy infrastructure and developing a diverse and robust national cyber workforce.
  1. Forge International Partnerships to Pursue Shared Goals by:
  • Leveraging international coalitions and partnerships among like-minded nations to counter threats to the digital ecosystem through joint preparedness, response, and cost imposition
  • Increasing the capacity of partners to defend themselves against cyber threats, both in peacetime and in crisis; and working with allies and partners to make secure, reliable, and trustworthy global supply chains for information and communications technology and operational technology products and services.

Recommendation: Although many are reluctant to go back to the IBM days of putting all your security solutions into a single basket, cloud vendors and MSSPs have made great progress in the past 5+ years to provide a long list of services under one roof. When looking for one security product it’s very important to think broader and understand the interconnected values between all of your other security tools (XDR!). Security decision makers will often find that re-shuffling several of their security solutions makes more sense than just adding them one brick at a time.

SIEM Use Case Guide – Part 3

Real World Examples

In this section let’s take the real world example of Bloodhound and discuss defensive measures for that use case.

Bloodhound

Step 1: Know thy Enemy.

Have a good list of threat intelligence sites (eg Mitre) that you can use to learn about an attack group or a specific exploit. Bloodhound uses ‘ingestors’ like Sharphound to collect information which it then uses to map out an attack path. So when looking for defenses you may need to look at the ingestors, not Bloodhound itself (although Sharphound may run as a sub-command within Bloodhound).

Step 2: Plan your defenses and build a Blue Team toolkit.

There are many ways to detect and block an exploit, depending on the conditions. But don’t take too much time thinking about the best way to do it when there are some easy wins that you can do right away, for example:

  • Ensure an EDR (and AntiMalware) is installed on all endpoints, and run reports to ensure their rules/signatures are all kept updated.
  • If the EDR vendor provides advanced features, make sure they’re enabled for optimal defenses – eg. enable blocking mode, enable advanced configurations such as Microsoft Defender ASR (Attack Surface Reduction)
  • Configuration Policies – Use tools like Microsoft Endpoint Manager (with Intune) to configure policies on your endpoints to provide a base ‘hardening’ for your devices. Ensure logging is enabled on all servers, including advanced logging for Powershell. If you’re using 1 or more cloud platforms you should be managing your infrastructure’s security policies with a CSPM (cloud security posture management) like Microsoft Defender for Cloud – this can also add additional defenses like FIM – File Integrity Management.

Step 3: Build Process For Faster Response

Once you have a list of tools/methods for building defenses, create a checklist and start filling it out. You’ll find that after adding a few rows a common pattern will arise for similar exploits, so your ‘Defender’ job should get a bit easier over time.

Example Defender Framework/Checklist

See also:

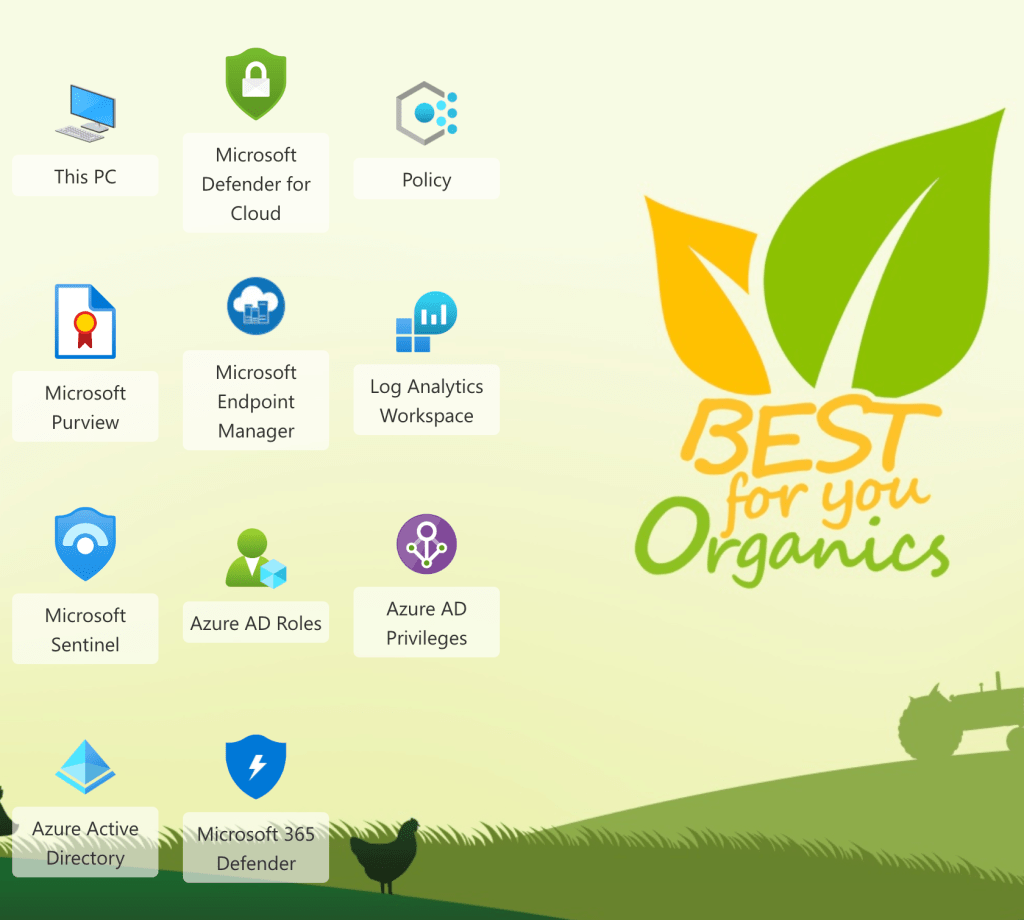
Making Security Fun with Microsoft Cloud Games

This is a really fun way to learns some practical skills with Microsoft Cloud security tools.

I would recommend this for anyone who has a Microsoft E5 license or anyone using Microsoft cloud based products who is ready to get serious about securing their cloud and on-prem environment with Microsoft security tools.

This is not for beginners.

It’s expected you have at least a basic understanding of what these security tools are shown in this screenshot from the game:

Expect to spend at least a couple of hours playing the game.

Have fun!

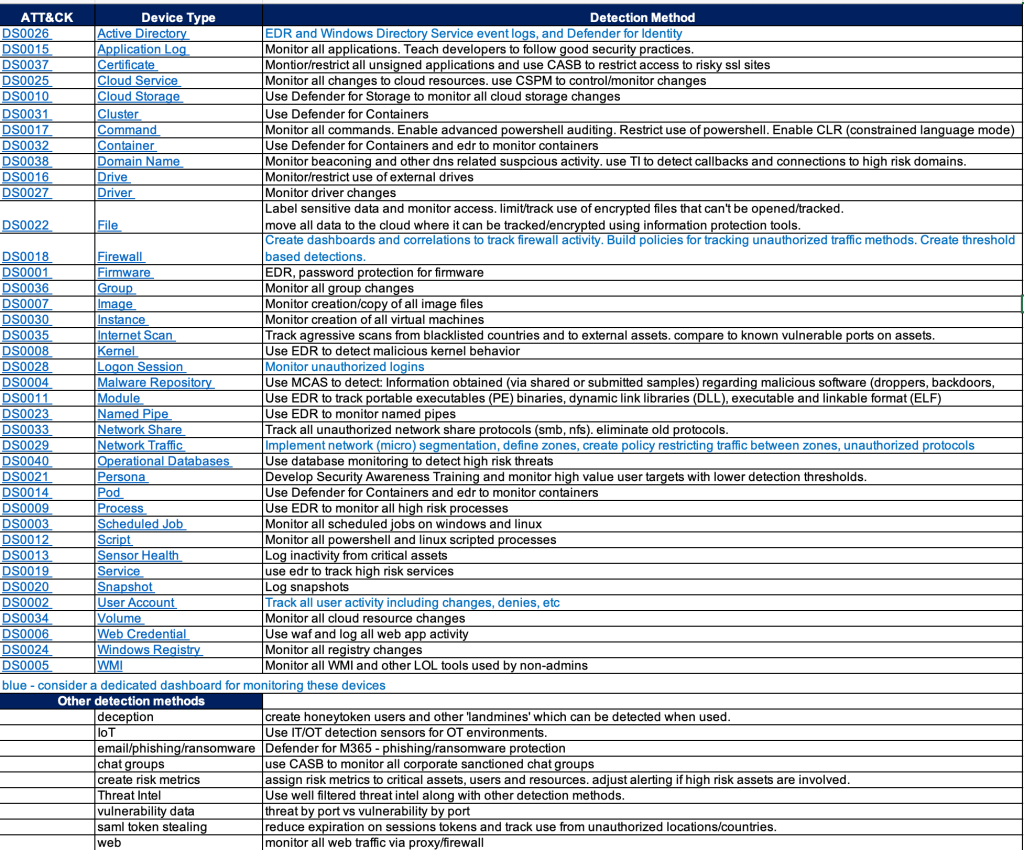
Mapping Cyber Defense Use Cases to Mitre ATT&CK Data Sources

Mitre ATT&CK provides so many ways to quantitatively think about approaches for defending against attackers.

However it can be challenging to map the ATT&CK matrix to to real-world defense methods.

One approach is to look at the ATT&CK data sources and research detections that would map to those data sources.

This still requires some experience and a bit of guessing since there doesn’t appear to be an easy button way to map data sources to detection tools.

Endpoint Detection vendors have done a pretty good job mapping detections to ATT&CK techniques but few of them share their mappings in a simple spreadsheet – that would greatly help validate your detection gaps.

SIEM products like Microsoft Sentinel have done a good job mapping detection rules AND log sources to ATT&CK.

The chart below is an example of an easy way to provide a path forward on where to focus efforts for detections. It also provides a gap analysis for any obvious security tools that may be missing in your environment.

And hopefully my short detection method recommendations will give you some ideas or at least stir conversation.

Installing the Azure Arc Agent for Windows Event Collection(and more)

If your SIEM is Microsoft Sentinel, then you likely need to collect Windows security events.
If you’ve never heard of ‘Arc’ then you’re likely collecting Windows logs using the legacy ‘Log Analytics Agent (Microsoft Monitoring Agent)’.
Microsoft recommends using the Azure Arc agent, along with the Azure Monitoring Agent, which will get push out automatically once configured in Arc, or Azure Monitor, or Sentinel.

The Arc agent extends the security controls you normally only get from cloud servers to your on-prem servers, and simplifies the number of agents needed for on-prem servers to work with Azure.

A discussion about Arc/CSPM/Azure Policy/Defender for Cloud/Asset Inventory/Attack Surface is out of the scope of this article, but trust me, you want to use Arc for all your on-prem windows and linux servers.

Prerequisites for Arc:

  • Local admin access to the on-prem windows/linux server
  • Global Admin access to Azure
  • On-prem server must have Internet access or a direct connection to Azure.
  • Sentinel Log Analytics Workspace

ARC agent installation:

Azure Monitor Agent (AMA) Installation

  • You actually don’t need to install AMA.
  • You configure a ‘Data Collection Rule’ in Sentinel or Azure Monitor with the preferred parameters, and this will enable the AMA as an ‘Arc Extension’

Sentinel Connector AMA Setup

  • Since most of the topics in this blog are around Sentinel, that will be the configuration discussed here.
    • You can also configure this in Azure Monitor and in Azure Arc, but the data might not then be accessible as easily in Sentinel (it may get stored in the Events table vs the SecurityEvents table – see references below)
  • In Sentinel go to: Connectors > “Windows Security Events via AMA”
  • Create a ‘Data Connection Rule (DCR)’:
    • Add your servers
    • Select the ‘Common’ filter – this is the best choice for all of the Security Events.
  • After a few minutes you should see your on-prem security events in the SecurityEvents table.

References:

https://docs.microsoft.com/en-us/azure/azure-monitor/faq#azure-monitor-agent

https://docs.microsoft.com/en-us/azure/azure-monitor/agents/azure-monitor-agent-windows-client